
Fig. 4.
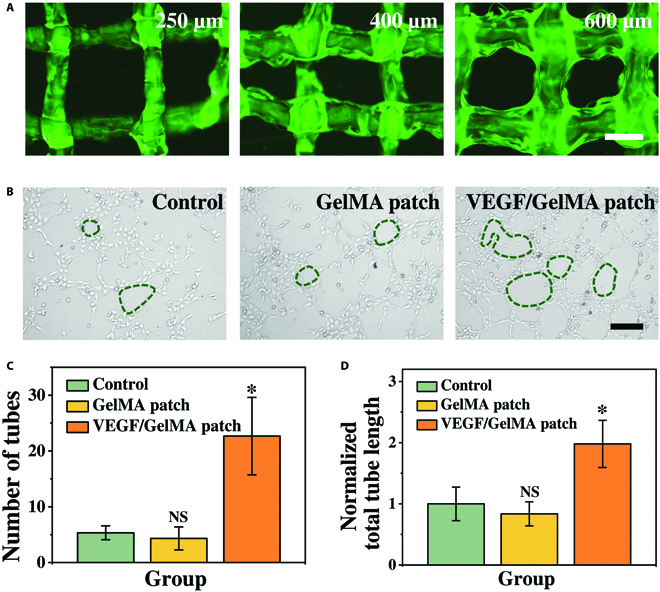
The angiogenetic effects of the VEGF-loaded GelMA/alginate patch. (A) The fluorescent images of the FITC-BSA-loaded GelMA/alginate patch with a line width of 250, 400, and 600 μm. (B) The representative optical microscopic images of HUVECs cultured in different groups. (C and D) Statistical analysis of the number of capillary-like structures (C) and the normalized total tube length (D) from different groups. The scale bars are 500 μm in (A) and 200 μm in (B).