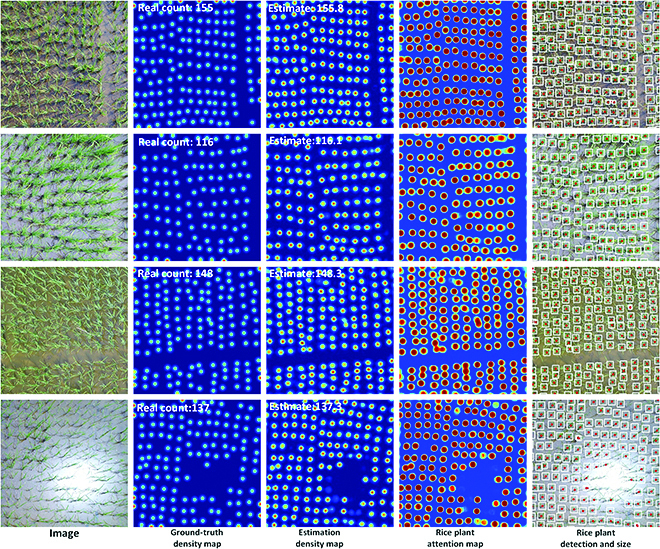
Fig. 7.

Visualization of the counting, locating, and sizing results in the URC dataset. The first column is the four test images, the second column is the ground-truth density maps, the third column is the estimated density maps, the fourth column is the PAMs, and the fifth column is the plant location and size prediction results.
