Fig. 9.

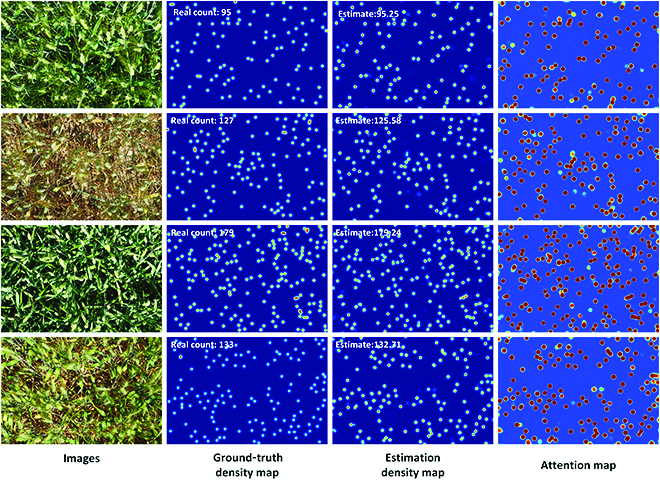
Visualization of the counting results in the WED dataset. The first column is the 4 test images, the second column is the ground-truth density maps, the third column is the estimated density maps, and the fourth column is the PAMs.

Visualization of the counting results in the WED dataset. The first column is the 4 test images, the second column is the ground-truth density maps, the third column is the estimated density maps, and the fourth column is the PAMs.