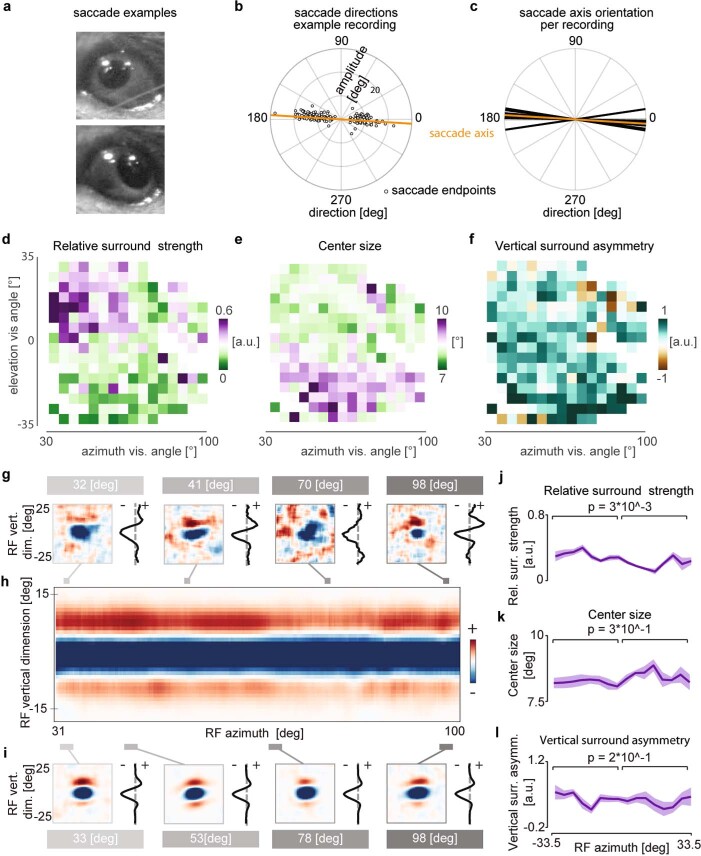
Extended Data Fig. 9. Sampling RGC bouton receptive field architecture across superior colliculus.
(a) Two example video frame crops of eye in two extreme horizontal positions. (b) Polar scatter plot of individual saccade amplitudes and directions (gray dots) in example recording and computed saccade axis (orange line, saccadic orientation tuning r̄ = 0.92). (c) Saccade axes of all recordings (n = 10 in 3 mice) close to the horizon (offset = 5.5 ± 2.9 °). (d) Relative surround strengths of mean 1-d-RFs within 4.3 ° bins. n = 45 ± 40 boutons per bin, only bins with n > = 5 boutons shown. (e & f) Same as (d), but for center size and vertical surround asymmetry, respectively. (g) Example RGC bouton receptive fields recorded using “shifting” white noise (left) and their respective 1-d RFs (right) at different azimuth positions (gray lines). (h) Average 1-d RFs, in smoothed 0.22 ° bins over azimuth. (i) Example average receptive fields binned at 2.9 ° visual angle (left), with their respective 1-d RFs (right) at different azimuth positions (gray bars). (j) Relative surround strength of 4.1 ° binned average 1-d RFs, shading indicating SEM across elevation bins (shown in (a)). Regression weights for both elevation and azimuth shown in Fig. 5g. (k, l) as (j), but for center size and vertical asymmetry, respectively. p-values indicated in j-l for two-sided Kolmogorov-Smirnov test.

