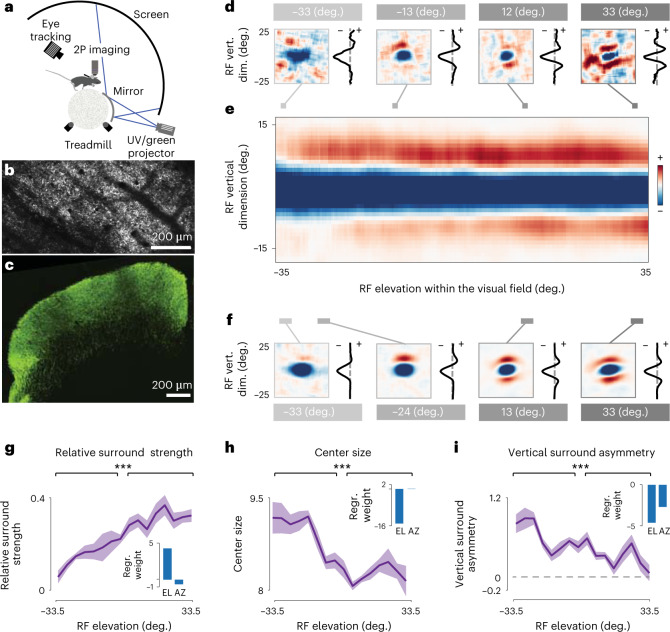
Fig. 5. Colliculus-wide retinal ganglion cell’s receptive field architecture.
a, Schematic of in vivo multiphoton imaging setup. b, FOV of a standard multiphoton recording of RGC axons expressing GCaMP8m in the SC (maximum projection, n = 10 sessions of three animals). c, Immunostaining of GCaMP8m of an example coronal section of the SC (n = 3 animals), showing homogeneous RGC labeling across the visual layers (green). d, Example RGC bouton RFs recorded using ‘shifting’ white noise (left) and their respective vertical 1D center profiles (1D RFs; right) at different elevation levels (gray lines). Note, ON-center RFs were inverted as done in Fig. 3. e, Average 1D RFs in 0.22° bins over elevation (smoothed horizontally in a 5° Gaussian window for display purposes). f, Example average RFs binned at a 4.1° visual angle (left), with their respective 1D RFs (right) at different elevation levels (gray bars). g, Relative surround strength of 4.1° binned and parametrized average 1D RFs; shading indicates the s.e.m. across azimuth bins (Extended Data Fig. 9g–i). Inset shows linear regression weights of individual bouton (n = 9,810) 1D RF parameters on elevation (EL) and azimuth (AZ). h,i, As in g, but for center size and vertical asymmetry, respectively. (P values for two-sided Kolmogorov–Smirnov test: 2.91 × 10⁻¹⁰ (g), 1.16 × 10⁻¹² (h) and 1.48 × 10⁻⁶ (i). 2p, two photon.

