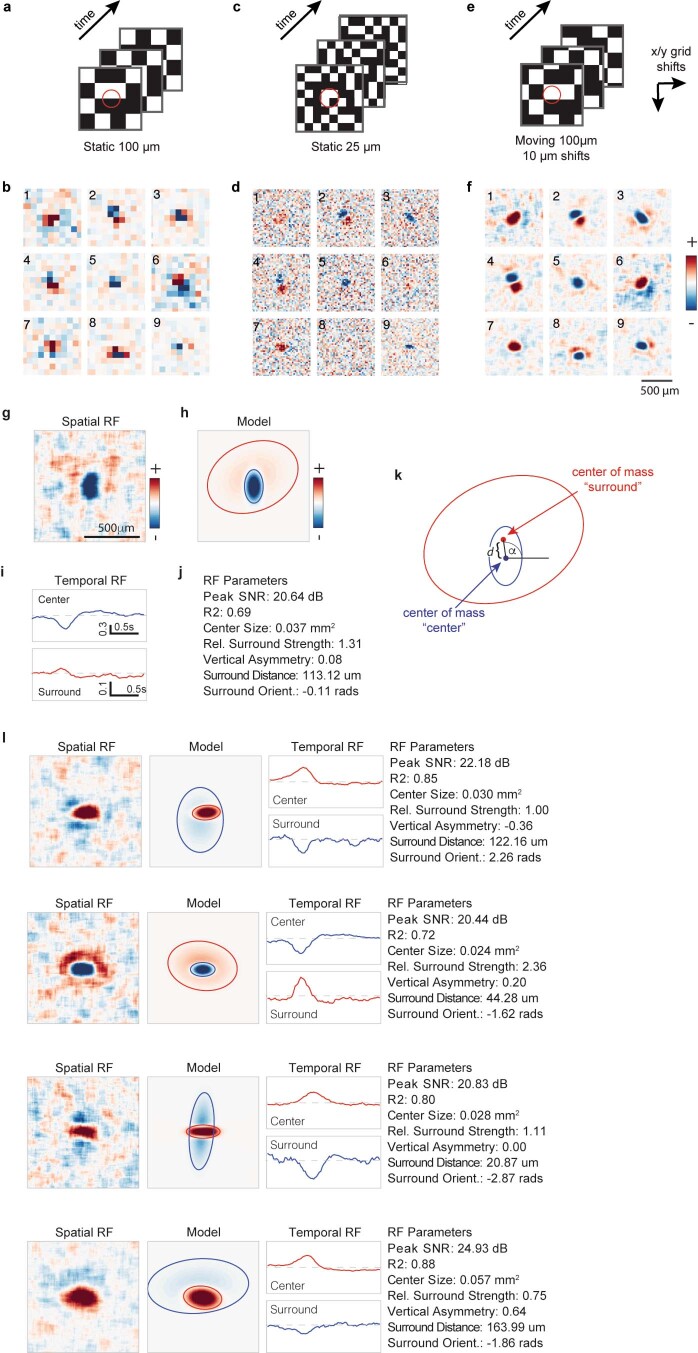
Extended Data Fig. 4. Comparison and parametrizations of RFs.
(a) Schematic of binary white noise stimuli used for recovering RFs during imaging experiments for static checkers with grid size 100 ×100 μm2. (b) Spatial RFs of 9 representative neurons were generated from the stimuli above. (c,d) Same as (a,b) for the same neurons, but for static 25 μm sized checkers. (e,f) Same as in (a,b) for the same neurons but for a shifting checkers with grid size 100 ×100 μm2, where the entire grid was shifted by random multiples of 10 μm in both x- and y-axis. While the static 100 μm checkers were too low resolution for automatic analysis and the static 25 μm checkers were unable to drive many neurons strongly enough to elicit sufficient responses for RF reconstruction, the moving white noise stimulus was able to unambiguously recover the most detail in the center–surround structure of RFs. (g) Spatial receptive field snapshot at the peak center strength. (h) Difference of Gaussians model fitted to the spatial RF. Ellipses represent 2 SD of the two Gaussians. (i) Temporal trace of the mean value of pixels within the respective Gaussians (top: center, bottom: surround). Dashed line represents no correlation between stimulus and response. (j) Values of different parameters of the RF reconstruction (Peak SNR), the goodness of fit (R2), center-surround structure (Center Size, Rel. Surround Strength) and eccentricity of surround (Vertical Asymmetry, Surround Distance, Surround Orientation). All neurons are plotted with the same scale and limits (after normalization). (k) Schematic depicting the parametrization of the receptive field in (g), showing the surround distance (“d”) and orientation (“𝛂”). (l) Example parametrizations.

