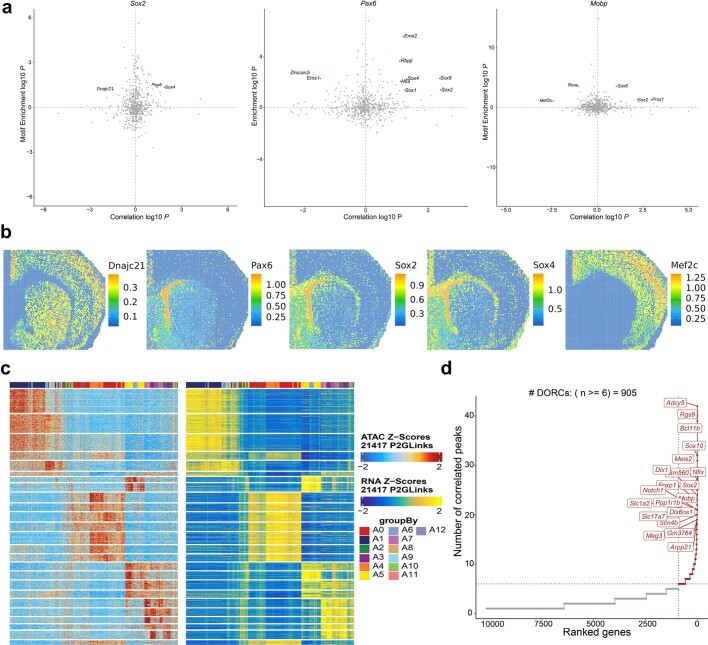
Extended Data Fig. 5. Further analysis of P22 mouse brain in spatial-ATAC-RNA-seq.
a, Candidate TF regulators of Sox2, Pax6, and Mobp. Highlighted points are TFs with abs(regulation score) ≥ 1 (−log10 scale)33, with all other TFs shown in gray (Z test). b, Spatial mapping of deviation scores for selected TF motifs. c, Heatmaps of peak-to-gene links in spatial-ATAC-RNA-seq. d, The number of significantly correlated peaks for each gene.

