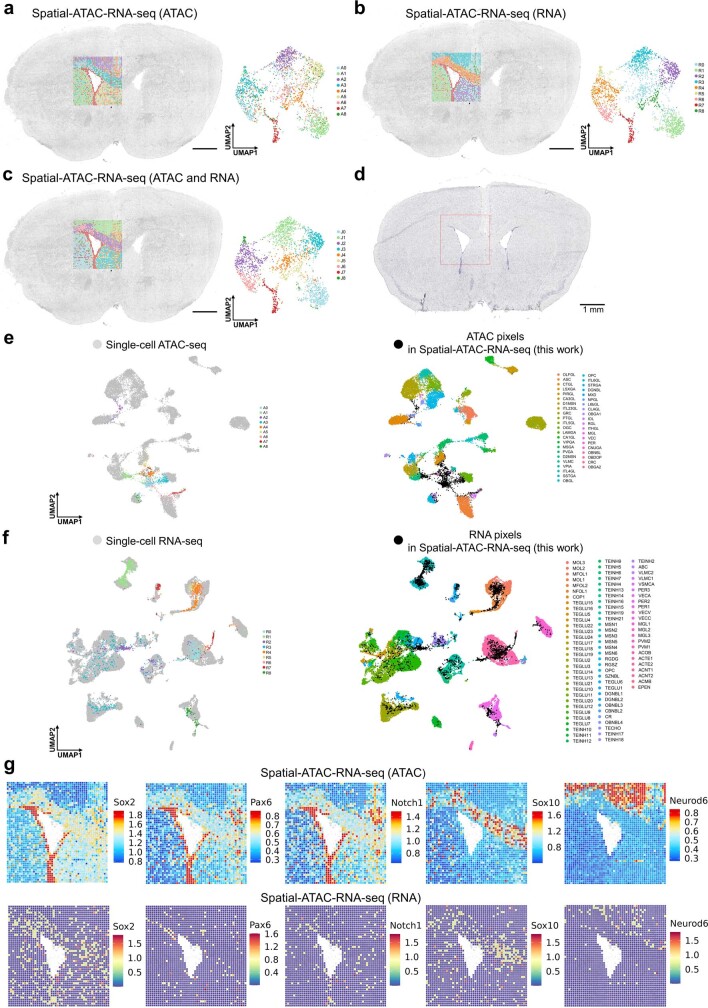
Extended Data Fig. 6. Spatial chromatin accessibility and transcriptome co-sequencing of P21mouse brain.
a—c, Spatial distribution and UMAP of all the clusters for ATAC (a), RNA (b), and joint clustering of ATAC and RNA (c) in spatial-ATAC-RNA-seq for the mouse brain. Pixel size, 20 µm. Scale bar, 1 mm. d, Nissl-stained image from an adjacent tissue section of P21 mouse brain. Scale bar, 1 mm. e, Integration of ATAC data in spatial-ATAC-RNA-seq with scATAC-seq data30 from mouse brain. f, Integration of RNA data in spatial-ATAC-RNA-seq with scRNA-seq data32 from mouse brain. g, Spatial mapping of GAS and gene expression for selected marker genes in different clusters for ATAC and RNA in spatial-ATAC-RNA-seq.

