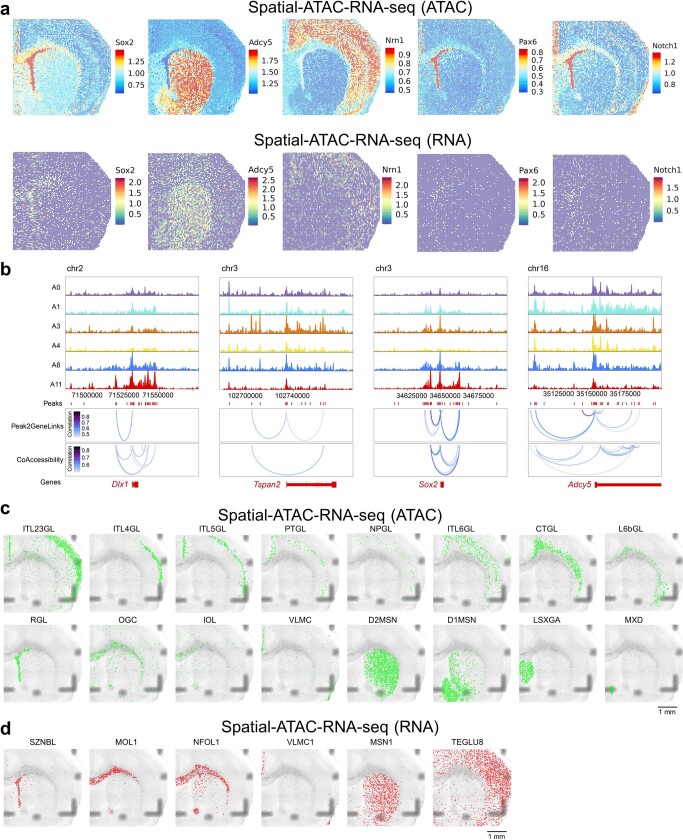
Extended Data Fig. 4. Further analysis of spatial-ATAC-RNA-seq for P22 mouse brain.
a, Spatial mapping of gene activity scores and gene expression for selected marker genes in spatial-ATAC-RNA-seq. b, Genome track visualization of marker genes with peak-to-gene links for distal regulatory elements and peak co-accessibility. c, Spatial mapping of cell types identified by label transfer from scATAC-seq30 to ATAC data. IT: intratelencephalic. PT: pyramidal tract. NP: near-projecting. CT: corticothalamic. L: layer. d, Spatial mapping of cell types identified by label transfer from scRNA-seq32 to RNA data.

