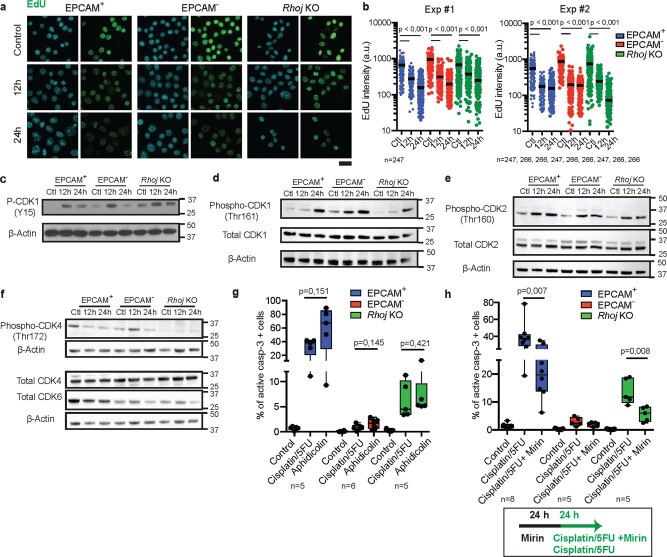
Extended Data Fig. 7. RHOJ promotes tolerance to replicative stress in EMT tumour cells following chemotherapy.
a, Immunofluorescence of EdU incorporation (green) in EPCAM+, EPCAM− and EPCAM− Rhoj KO cells treated with cisplatin/5FU for 12 and 24h. EdU pulse is given 30 min before sampling. Nuclei are counterstained with DAPI (blue) (Scale bar, 25μm). b, EdU intensity measured with Cell profiler software in EPCAM+, EPCAM− and EPCAM− Rhoj KO cells treated with cisplatin/5FU for 12 and 24h. (n represents the number of nuclei analysed from 2 independent experiments ; a.u., arbitrary unit, Medians are shown, Kruskal-Wallis test) c-f, Western blot of p-CDK1 at Y15 (c), at Thr161 and total CDK1 (d), p-CDK2 at Thr160 and total CDK2 (e), p-CDK4 at Thr172, total CDK4 and CDK6 (f) and corresponding β-Actin in EPCAM+, EPCAM− and Rhoj KO cells exposed to cisplatin/5FU treatment showing the differential activation of the CDKs in response to chemotherapy in the different tumour cell types. Activation of CDK1 was observed in EPCAM− cells as shown by transient level of inhibitory phosphorylation and earlier appearance of activating phosphorylation of CDK1 in response to chemotherapy as compared to EPCAM+ and Rhoj KO Epcam- cells. Same levels of activating CDK2 phosphorylation was found in all cell types and sustained activating CDK4 phosphorylation was observed in EPCAM− cells 12h after chemotherapy compared to EPCAM+ and Rhoj KO EPCAM− cells suggesting that EPCAM− cells are allowed to progress in the cell cycle following chemotherapy. Molecular weights (kDa) are indicated on the right side of the blots (n = 2). g, FACS quantification of the percentage of activated caspase-3 positive cells in YFP+ EPCAM+, EPCAM− and EPCAM− Rhoj KO in response to 24h aphidicolin (50μM) and cisplatin/5FU. h, FACS quantification of the percentage of activated caspase-3 positive cells in response to 24h combination of cisplatin/5FU with MRE11 inhibitor (Mirin 50μM). Lower panel shows drug treatment scheme. (n represents the number of independent primary cultured cell lines). In g and h, Kruskal-Wallis test followed by Mann-Whitney U-tests. p-values adjusted for multiple comparisons by Bonferroni correction, box boundaries represent 25th and 75th percentiles; whiskers, minimum and maximum; centre line, median.

