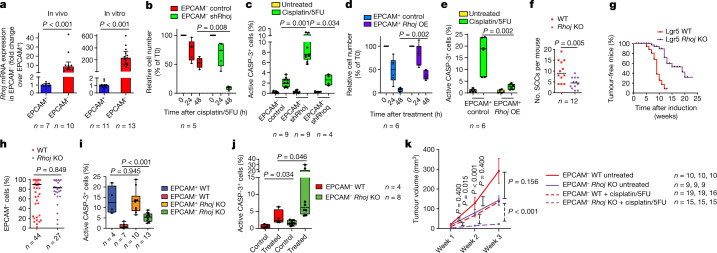
Fig. 2. RHOJ mediates resistance to chemotherapy associated with EMT.
a, RT–qPCR analysis of Rhoj expression in EPCAM− cells compared with in EPCAM+ cells in vivo (left) and in vitro (right). Data are median ± interquartile range, normalized to the housekeeping gene Tbp. n values indicate the number of independent experiments. b, The relative cell number of EPCAM− control and Rhoj shRNA KD cells 24 h and 48 h after cisplatin/5FU administration in vitro. n values indicate the number of independent experiments. c, FACS quantification of the percentage of activated caspase-3-positive cells in EPCAM− control, Rhoj shRNA KD and Rhoq shRNA KD cells 24 h after cisplatin/5FU administration. n values indicate the number of independent experiments. d,e, The relative cell number (d) and FACS quantification of the percentage of activated caspase-3-positive cells (e) of control and RHOJ-overexpressing (OE) EPCAM+ cells 24 h and 48 h after cisplatin/5FU administration in vitro. n = 6 independent experiments. f,g, The median number of SCCs per mouse (f) and kinetics of tumour appearance (g) in control and Rhoj-KO mice. n values indicate the number of mice. h, FACS quantification of the percentage of EPCAM− cells of tumours from WT and Rhoj-KO SCCs. Data are median. n values indicate the number of mice. i,j, FACS quantification of the percentage of activated caspase-3-positive cells in EPCAM+ and EPCAM− cells 24 h after cisplatin/5FU administration from WT (n = 4 and 7 SCCs) and Rhoj-KO mice (n = 10 and 13 SCCs) in vivo (i) and in EPCAM− cells from WT-derived (n = 4) and Rhoj-KO-derived (n = 8) cell lines 24 h after cisplatin/5FU administration in vitro (j). n values indicate the number of independent experiments. k, The tumour volume after cisplatin/5FU administration to mice that were grafted with WT and Rhoj-KO tumour cells compared with untreated mice. Data are mean ± s.e.m. n values indicate the number of mice. For a–f and h–k, statistical analysis was performed using two-sided Mann–Whitney U-tests. P values were adjusted using Bonferroni correction when multiple comparisons were performed. For the box plots, the centre line shows the median, the box limits represent the 25th and 75th percentiles, and the whiskers show the minimum and maximum values.

