
Fig. 3. Proteomic analysis after Rhoj KO in EMT tumour cells.
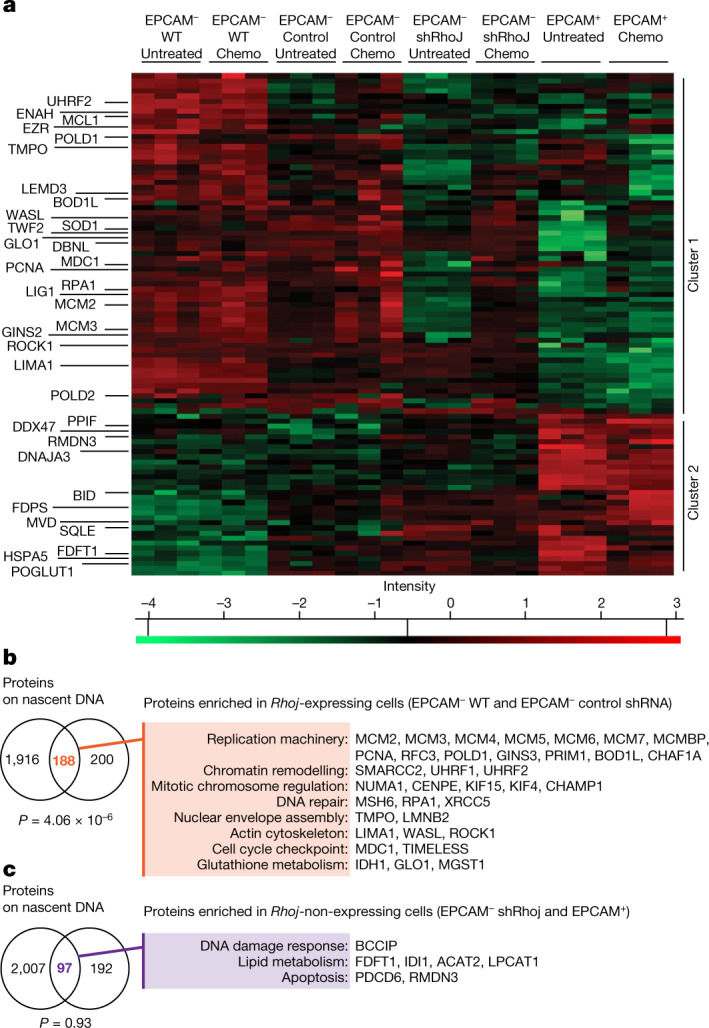
a, The relative intensities of selected upregulated proteins identified in RHOJ-expressing cells (EPCAM− WT and EPCAM− control shRNA) and in RHOJ-non-expressing cells (EPCAM+ and EPCAM− Rhoj shRNA KD) in untreated conditions and after 24 h of cisplatin/5FU treatment. Two major clusters were observed. n = 3 technical replicates. Z-scored log2-transformed label-free quantitation (LFQ) intensities are shown. Statistical analysis was performed using two-way ANOVA; P < 0.05. Individual P values are provided as Source Data. b,c, The overlap between a published proteomic study of proteins associated with replicative fork (iPond)20 and the proteins enriched in RHOJ-expressing cells (b) or the proteins enriched in RHOJ-non-expressing cells (c) in the untreated condition and 24 h after cisplatin/5FU administration. The P value was calculated using the hypergeometric test.