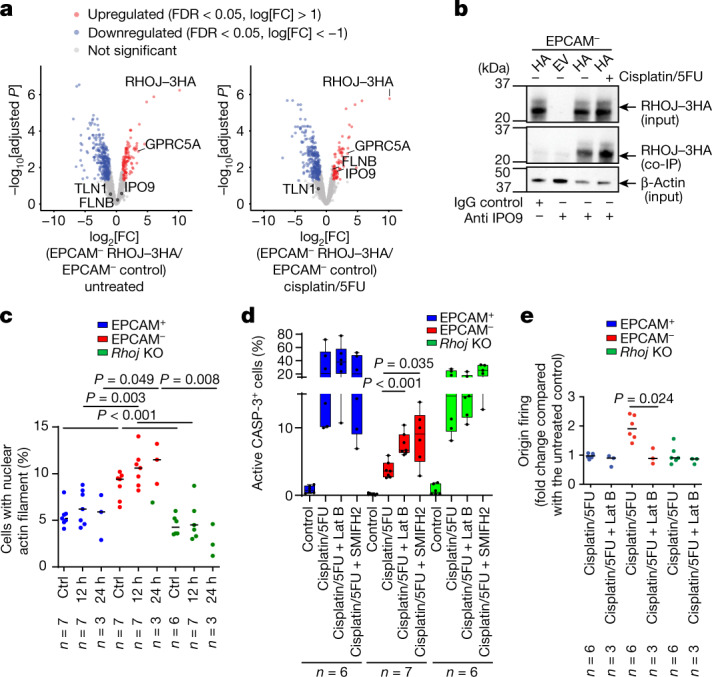
Fig. 5. RHOJ promotes cell survival and DNA repair by regulating nuclear actin polymerization.

a, Differential protein expression detected by AP–MS analysis of protein complexed with 3HA-tagged RHOJ in EPCAM− cells. Volcano plot showing the statistical significance (−log10-transformed P) and the fold change (log2) of proteins identified by MS (false-discovery rate (FDR) < 0.05) in the untreated condition (left) and after 12 h of cisplatin/5FU treatment (right). Selected proteins enriched after immunoprecipitation of 3HA-tagged RHOJ are highlighted. b, Co-immunoprecipitation using anti-IPO9 or IgG control antibodies followed by western blotting using anti-HA antibodies, revealing the association between IPO9 and RHOJ–3HA protein in EPCAM− cells 12 h after cisplatin/5FU treatment. n = 2. c, Quantification of the percentage of cells presenting nuclear actin filaments in EPCAM+, EPCAM− and EPCAM− Rhoj-KO cells expressing nuclear actin chromobody-GFP 12 h and 24 h after cisplatin/5FU treatment (>250 nuclei were quantified per replicate). Data are median. Statistical analysis was performed using ANOVA, with condition, experience and their interaction. P values were adjusted using two-way post hoc Sidak tests. n values indicate the number of replicates. d, FACS quantification of the percentage of activated caspase-3-positive cells in EPCAM+, EPCAM− and EPCAM− Rhoj-KO cells 24 h after treatment with cisplatin/5FU and latrunculin B (Lat B) or SMIFH2 inhibitor. For the box plots, the centre line shows the median, the box limits represent the 25th and 75th percentiles, and the whiskers show the minimum and maximum values. n values indicate the number of replicates. e, The relative proportion of origin firing in EPCAM+, EPCAM− and EPCAM− Rhoj-KO cells treated with cisplatin/5FU or a combination of cisplatin/5FU and latrunculin B for 12 h compared with the untreated condition. Data are median. n values indicate the number of independent experiments. For d and e, statistical analysis was performed using Kruskal–Wallis tests followed by two-sided Mann–Whitney U-tests. P values were adjusted for multiple comparisons using Bonferroni correction. Gel source data are provided in Supplementary Fig. 1.
