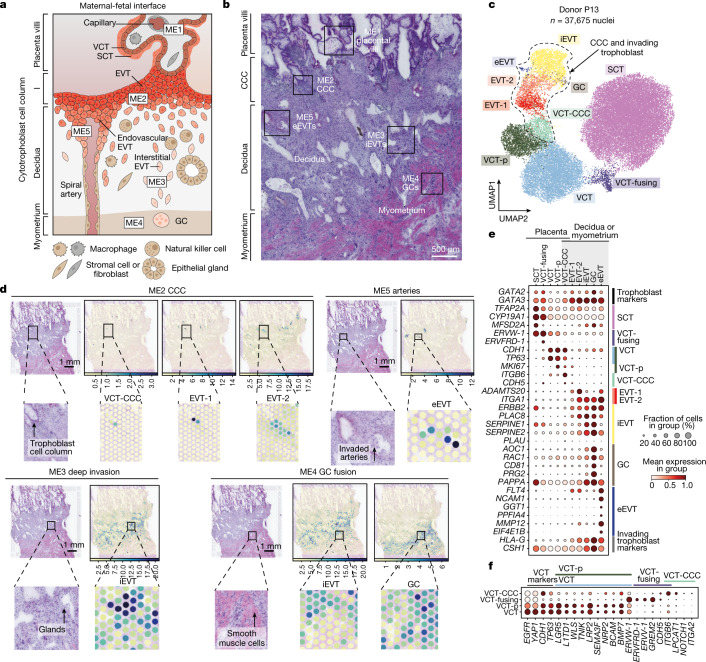
Fig. 1. Trophoblast cell states in the early maternal–fetal interface.
a, Schematic representation of the maternal–fetal interface during the first trimester of human pregnancy. b, Histological overview (haematoxylin and eosin (H&E) staining) of the implantation site of donor P13 (approximately 8–9 PCW) (n = 1). Black outlines indicate trophoblast microenvironments in space. c, Uniform manifold approximation and projection (UMAP) plot of snRNA-seq of donor P13 trophoblast nuclei in the maternal–fetal interface (n = 37,675 nuclei) coloured by cell state. d, Overview of spatial locations of invading trophoblast cell states in Visium spatial transcriptomics data of a section of donor P13 tissue (the position of the capture area is indicated with an arrow in Extended Data Fig. 1d). Spot colour indicates cell state density computed by cell2location, which is the number of cells of a given cell state in a Visium spot. Invading trophoblast cell states are grouped on the basis of the spatial microenvironment that they represent. e, Dot plots showing normalized, log-transformed and variance-scaled expression of genes (y-axis) characteristic of trophoblast cell states (x-axis) in donor P13 snRNA-seq data. f, Dot plots showing normalized, log-transformed and variance-scaled expression of genes (x-axis) characteristic of villous cytotrophoblast (y-axis) in donor P13 snRNA-seq data.

