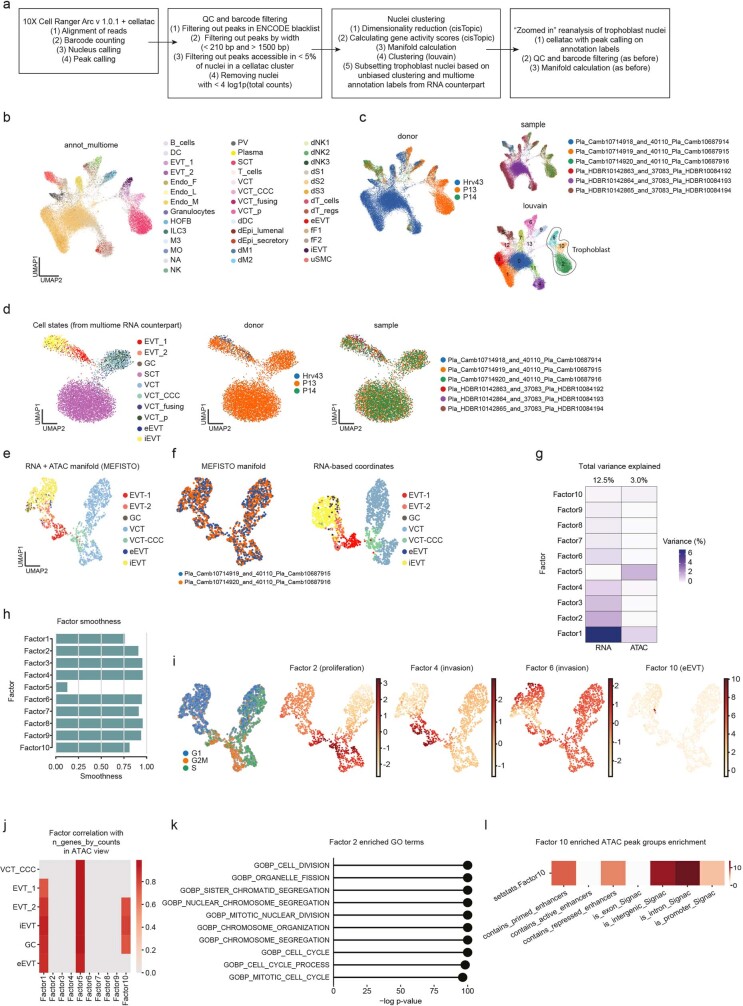
Extended Data Fig. 7. Multimodal analysis of extravillous trophoblast invasion.
a: Overview of the computational pipeline implemented for analysis of multimodal data. b-c: UMAP (uniform manifold approximation and projection) scatterplot of multimodal snATAC-seq data from donors P13, P14 and Hrv43 (n = 52,798 nuclei) coloured by cell state (b), donor, sample (10X library) or unbiased clustering labels (c). Data is annotated based on the corresponding single-nuclei RNA sequencing (snRNA-seq) cell state assignment. d: UMAP scatterplot of integrated multimodal single-nuclei ATAC sequencing (snATAC-seq) data for trophoblast only from donors P13, P14 and Hrv43 (n = 7449 nuclei) coloured by cell state, donor and sample (10X library). e: UMAP scatterplot of multiome (snRNA-snATACseq) data of invading trophoblast cells from donor P13 (n = 1605 nuclei) coloured by cell state. The manifold is calculated based on dimensionality reduction performed by MEFISTO (model with n = 9 factors). f: (Left) UMAP scatterplot of multiome (snRNA-snATACseq) data of invading trophoblast cells from donor P13 (n = 1605 nuclei) coloured by sample. The manifold is calculated based on dimensionality reduction performed by MEFISTO (model with n = 9 factors). (Right) Scatterplot of UMAP coordinates obtained from the RNA expression data that were used as covariates for MEFISTO, coloured by cell state. g: Heatmap representing percentage of variance explained by each MEFISTO factor in each data modality. h: Smoothness along differentiation estimated with MEFISTO. i: UMAP scatterplot of multiome (snRNA-snATACseq) data of invading trophoblast cells from donor P13 (n = 1605 nuclei) coloured by cell cycle phase and MEFISTO factor values for important selected factors. j: Spearman’s rank correlation coefficients of each latent factor learned with MEFISTO and the number of genes per counts in snATAC-seq data (multiome). k: Gene set (RNA) enrichment analysis overview of MEFISTO factor 2 using two-sided parametric t-test, FDR is used to rank gene sets. l: Peak set (ATAC) enrichment analysis overview of MEFISTO factor 10 using two-sided parametric t-test, FDR is used to rank peak sets. Villous cytotrophoblast (VCT), cytotrophoblast cell column (CCC), proliferative (p), extravillous trophoblast (EVT), interstitial EVTs (iEVTs), giant cells (GC), endovascular EVT (eEVT), dendritic cells (DC), lymphatic (l), maternal (m), fetal (f) Hofbauer cells (HOFB), innate lymphocytes (ILC), macrophages (M), monocytes (MO), natural killer (NK), perivascular (PV), decidual (d), epithelial (epi), stromal (S), fibroblasts (F), uterine smooth muscle cells (uSMC).

