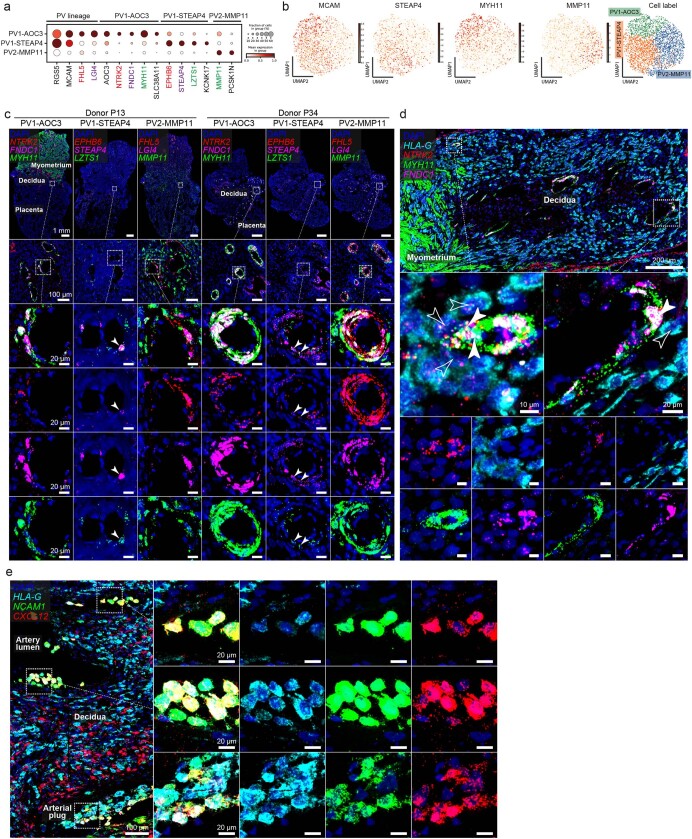
Extended Data Fig. 12. Interactions between trophoblast and perivascular (PV) cells.
a: Dot plot showing normalised, log-transformed and variance-scaled expression of perivascular (PV) cell state markers. b: UMAP (uniform manifold approximation and projection) scatterplot of scRNA-seq of PV cells (n = 2768 cells) coloured by the scaled gene expression of PV cell state markers. c: (Top) High-resolution imaging of adjacent sections of maternal-fetal interface stained by multiplexed smFISH for three gene panels, from two donors. Dashed squares indicate areas shown magnified underneath (middle and below), highlighting PV1-AOC3, PV1-STEAP4, and PV2-MMP11 cells expressing each of their three respective marker genes. Solid arrows indicate relatively sparse PV1-STEAP4 cells in second and fifth columns. d: (Top) High-resolution imaging of a section of decidua stained by smFISH for HLA-G (EVTs) multiplexed with MYH11, FNDC1, and NTRK2 (PV1-AOC3); dashed squares indicate areas shown magnified below. (Middle) solid and outlined arrows indicate neighbouring PV1-AOC3 cells expressing NTRK2 and EVTs, respectively. Representative image of samples from two donors. e: (Left) High-resolution imaging of a section of decidua stained by multiplexed smFISH for HLA-G, NCAM1, and CXCL12. Dashed squares highlight arteries containing HLA-G+ NCAM1+ eEVTs expressing CXCL12, shown magnified to right. Representative image of samples from two donors.

