
Fig. 2. Transcription factors that are active during EVT invasion.
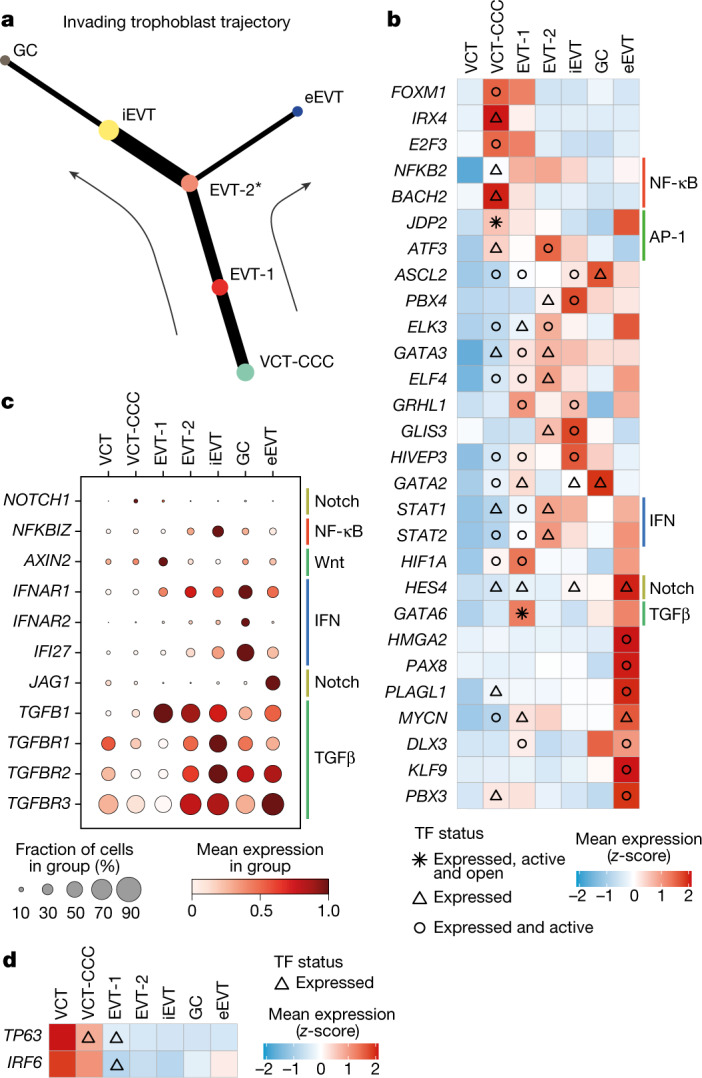
a, Representative tree of EVT differentiation trajectory inferred by StOrder (Methods). The tree shown is inferred with α = 0.4 and β = 0.5 for snRNA-seq and spatial transcriptomics data from donors P13 (5 capture areas), P14 (2 capture areas) and Hrv43 (1 capture area). Tree edge thickness is proportional to connectivity (joint measure inferred from snRNA-seq data and spatial transcriptomics data) between two cell types connected by that edge. The asterisk indicates the bifurcation point. b, Heat map showing z-scores of normalized, log-transformed and scaled expression of transcription factor (TF) genes upregulated during trophoblast invasion in donor P13 snRNA-seq data. The x-axis indicates cell state, the y-axis lists transcription factors. Differential expression (upregulated genes) is tested along the invading trophoblast trajectory (as shown in a) in a retrograde manner using the limma approach (false discovery rate (FDR) < 0.05, with Bonferroni correction for multiple hypotheses testing). Coloured bars to the right of heat map indicate members of selected pathways. IFN, interferon. c, Dot plot showing normalized, log-transformed and variance-scaled expression of genes (x-axis) of signalling molecules upregulated in EVT (y-axis) in donor P13 snRNA-seq data. d, Heat map showing z-score of normalized, log-transformed and variance-scaled expression of transcription factors (x-axis) downregulated during trophoblast invasion in P13 in trophoblast states (y-axis). Differential expression (downregulated genes) is tested along invading trophoblast trajectory (as shown in a) in a retrograde manner using the limma approach (FDR < 0.05, with Bonferroni correction for multiple hypotheses testing).