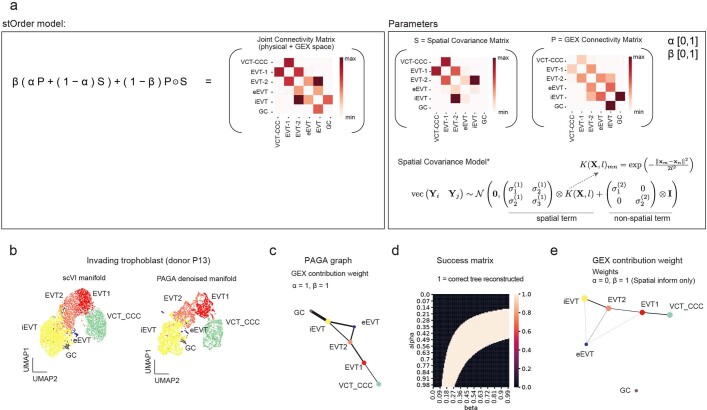
Extended Data Fig. 4. Analysis of extravillous trophoblast invasion trajectory using stOrder.
a: Schematic overview of StOrder approach representing the workflow of joint cell differentiation trajectory inference from gene expression and spatial transcriptomics data (See methods). b: (Left) Main UMAP (uniform manifold approximation and projection) scatterplot and (right) denoised manifold used for PAGA trajectory inference of all trophoblast cell states in donor P13 single-nuclei RNA sequencing (snRNA-seq) data. c: PAGA reconstruction of putative trajectory tree for all extravillous trophoblast cell states. This corresponds to the trajectory tree inferred by stOrser with α = 1, β = 1 parameters from donor P13 snRNA-seq data and spatial transcriptomics data of donors P13 (5 capture areas), P14 (2 capture areas) and Hrv43 (1 capture area). d: Heatmap of binary success matrix of stOrder approach for pairs of (α,β), values (along Y and X axes, respectively). Assigned matrix value is 1 if a tree of correct topology has been reconstructed for that pair of (α,β) values, and 0 if no tree of correct topology was reconstructed. e: Reconstruction of putative invading trophoblast trajectory tree based solely on spatial data inferred by stOrder with α = 0, β = 1 parameters from donor P13 snRNA-seq data and spatial transcriptomics data of donors P13 (5 chips), P14 (2 chips) and Hrv43 (1 chip). Villous cytotrophoblast (VCT), cytotrophoblast cell column (CCC), extravillous trophoblast (EVT), interstitial EVTs (iEVTs), giant cells (GC), endovascular EVT (eEVT).

