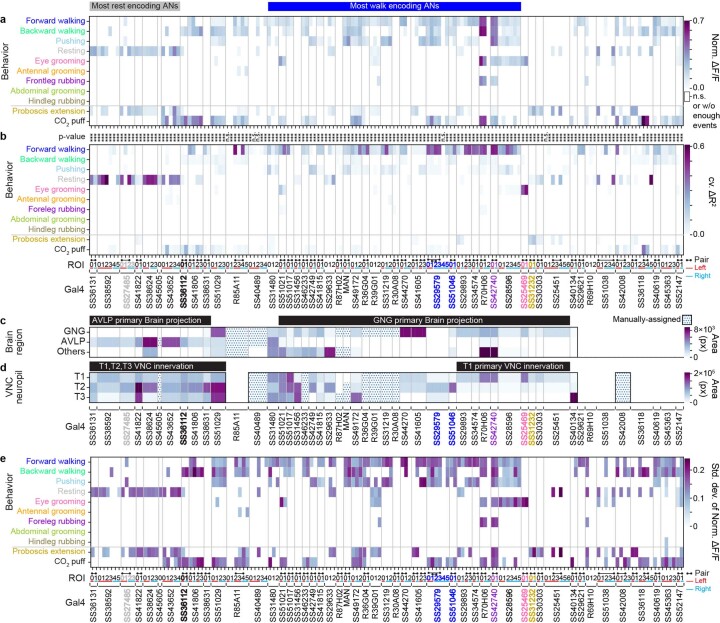
Extended Data Fig. 7. Normalized mean activity (ΔF/F) of ascending neurons during behaviors, and a summary of their behavioral encoding, brain targeting, and VNC patterning.
(a) Normalized mean ΔF/F, normalized between 0 and 1, for a given AN across all epochs of a specific behavior. Analyses were performed for 157 ANs recorded from 50 driver lines. Note that fluorescence for non-orthogonal behaviors/events may overlap (for example, for backward walking and puff, or resting and proboscis extensions). Conditions with less than ten epochs longer than 0.7 s are masked (white). One-way ANOVA and two-sided posthoc Tukey tests to correct for multiple comparisons were performed to test if values are significantly different from baseline. Non-significant samples are also masked (white). (b) Variance in AN activity that can be uniquely explained by a regressor (cross-validated ΔR2) for behaviors as shown in Fig. 2d. Non-orthogonal regressors (PE and CO2 puffs) are separated from the others. P-values report the one-tailed F-statistic of overall significance of the complete regression model with no regressors shuffled without adjustment for multiple comparisons (*p<0.05, **p<0.01, and ***p<0.001). (c,d) The most substantial AN (c) targeting of brain regions, or (d) patterning of VNC regions, as quantified by pixel-based analysis of MCFO labelling. Driver lines that were manually quantified are indicated (dotted cells). Projections that could not be unambiguously identified are left blank. Notable encoding and innervation patterns are indicated by bars above each matrix. Lines (and their corresponding ANs) selected for more in-depth analysis are color-coded by the behavioral class that best explains their neural activity: SS27485 (resting), SS36112 (puff responses), SS29579 (walking), SS51046 (turning), SS42740 (foreleg-dependent behaviors), SS25469 (eye grooming), and SS31232 (proboscis extensions). (e) Standard deviation of normalized activity (ΔF/F), normalized between 0 and 1, for a given AN across all epochs of a specific behavior.

