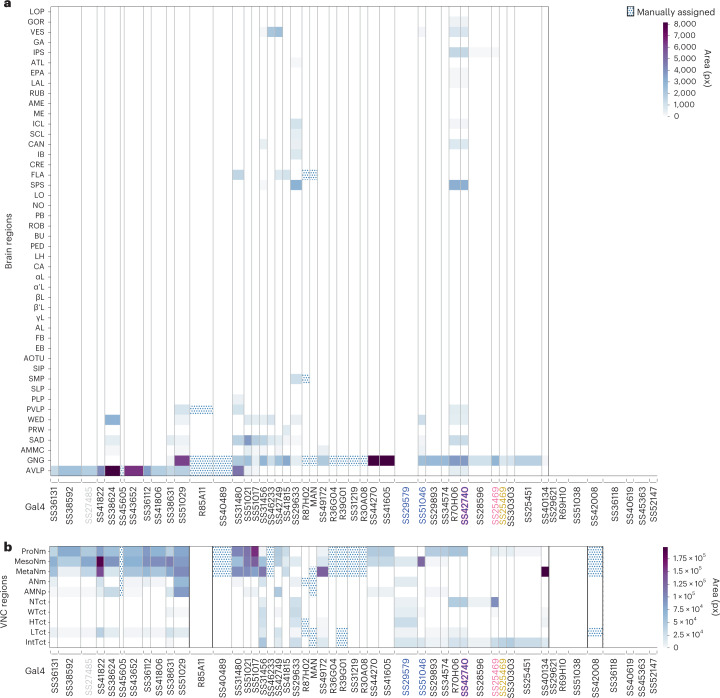
Fig. 3. ANs principally project to the brain’s AVLP and GNG and the VNC’s leg neuromeres.
Regional innervation of the brain (a) or the VNC (b). Data are for 157 ANs recorded from 50 driver lines and automatically quantified through pixel-based analyses of MCFO-labeled confocal images. Other, manually quantified driver lines are indicated (dotted). Lines for which projections could not be unambiguously identified are left blank. Lines selected for more in-depth evaluation are color-coded by the behavioral state that best explains their neural activity: SS27485 (resting), SS36112 (puff responses), SS29579 (walking), SS51046 (turning), SS42740 (foreleg-dependent behaviors), SS25469 (eye grooming) and SS31232 (PEs). Here, ROI numbers are not indicated because there is no one-to-one mapping between individual ROIs and MCFO-labeled single neurons.

