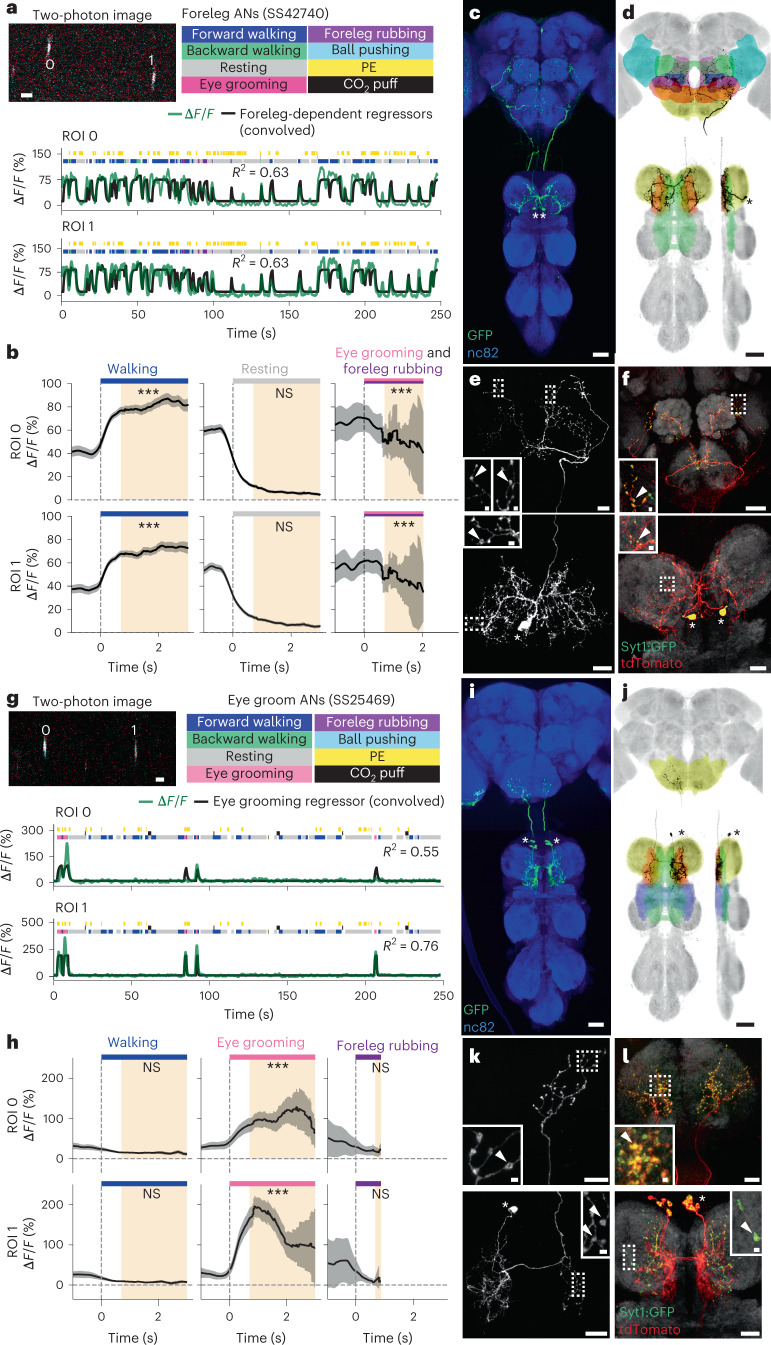
Fig. 6. Functional and anatomical properties of ANs that encode multiple foreleg behaviors or only eye grooming.
a,g, Top left: two-photon image of axons from an SS42740-Gal4 (a) or an SS25469-Gal4 (g) animal expressing OpGCaMP6f (cyan) and tdTomato (red). ROIs are numbered. Scale bar, 5 μm. Bottom: behavioral epochs are color-coded. Representative ΔF/F time series from two ROIs (green) overlaid with a prediction (black) obtained by convolving all foreleg-dependent behavioral epochs (forward and backward walking as well as eye, antennal and foreleg grooming) for an SS42740-Gal4 animal (a) or eye grooming epochs for an SS25469-Gal4 animal (g) with Ca2+ indicator response functions. Explained variance is indicated (R2). b,h, Mean (solid line) and 95% confidence interval (gray shading) of ΔF/F traces for foreleg ANs (b) during epochs of forward walking (left), resting (middle) or eye grooming and foreleg rubbing (right) or eye groom ANs (h) during forward walking (left), eye grooming (middle) or foreleg rubbing (right) epochs. 0 s indicates the start of each epoch. Data more than 0.7 s after onset (yellow region) are compared with an Otsu thresholded baseline (one-way ANOVA and two-sided Tukey post hoc comparison, ***P < 0.001, **P < 0.01, *P < 0.05, NS, not significant). c,i, Standard deviation projection image for an SS42740-Gal4 (c) or an SS27485-Gal4 (i) nervous system expressing smFP and stained for GFP (green) and Nc82 (blue). Cell bodies are indicated (white asterisks). Scale bars, 40 μm. d,j, Projections as in c and i but for one MCFO-expressing, traced neuron (black asterisks). The brain’s GNG (yellow), AVLP (cyan), SAD (green), VES (pink), IPS (blue) and SPS (orange) and the VNC’s neck (orange), intermediate tectulum (green), wing tectulum (blue) and prothoracic leg neuromere (yellow) are color-coded. Scale bars, 40 μm. e,f,k,l, Higher magnification projections of brains (top) and VNCs (bottom) from SS42740-Gal4 (e,f) or SS25469-Gal4 (k,l) animals expressing the stochastic label MCFO (e,k) or the synaptic marker, syt:GFP (green) and tdTomato (red) (f,l). Insets magnify dashed boxes. Indicated are cell bodies (asterisks) and bouton-like structures (white arrowheads). Scale bars for brain images and insets are 20 μm and 2 μm, respectively. Scale bars for VNC images and insets are 20 μm and 2 μm, respectively.

