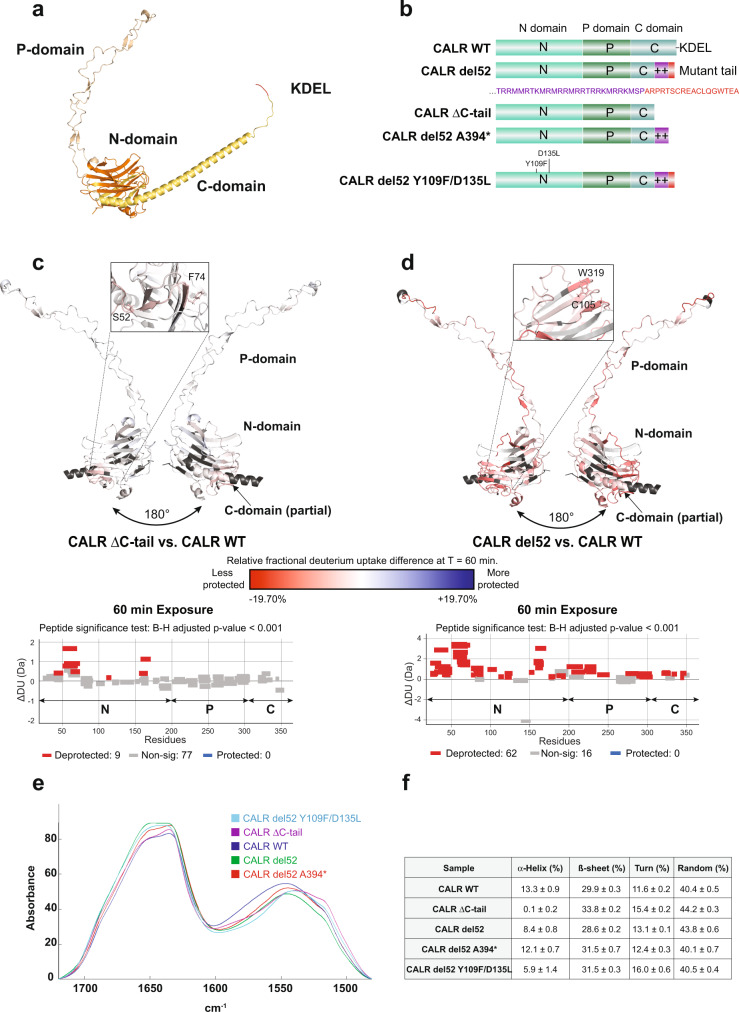
Fig. 1. Structural changes induced by CALR frameshift mutation.
a Structure of full length CALR WT predicted using AlphaFold 2.018. The N-domain is shown in orange, the P-domain in wheat, the C-domain in yellow and the KDEL in red. b Representation of the domains and C-terminal sequences of CALR WT and CALR del52 or variants thereof used in FTIR spectroscopy and HDx-MS experiments. c, d Top: Structure model (AlphaFold 2.018) of the common region between CALR WT and CALR del52 (corresponding to CALR ΔC-tail). Colors represent the difference in relative fractional uptake (ΔRFU) between CALR ΔC-tail and CALR WT (c) or between CALR del52 and CALR WT (d) at 1 h incubation in deuterium. Regions in red and blue are respectively less and more protected in CALR ΔC-tail (c) or CALR del52 (d) compared to CALR WT. The scale from red to blue is proportional to the ΔRFU between indicated CALR species with dark red and dark blue corresponding to highest differential. Dark gray represents regions without peptide coverage for the given time point. The N-glycans binding domain of CALR which is more exposed in CALR del52 compared to CALR WT is highlighted. Raw data are provided in the source file. Bottom: Wood’s plots generated with Deuteros 2.035. Each bar (wood) represents the H-D exchange differential for a single peptide between indicated CALR species at 1 h incubation in deuterium. Peptides in red (deprotected) or blue (protected) have significant differential H-D exchange (p < 0.001) with the peptide-level significance testing as described35 (n = 3). The N-, P- and C-domains of CALR are indicated on the plots by letters N, P and C, respectively. Source data are provided as a Source data file. e Comparison of the mean spectra recorded for each sample to analyze the protein secondary structure. These spectra have been baseline-corrected and normalized. Each sample is identified by a unique color indicated in the legend. The unprocessed spectra are provided in Supplementary Fig. 4a. f Secondary structure predictions using the method developed on our in-house database (see Supplementary Methods). The prediction is realized on each individual FTIR spectrum. The average and the standard deviation for the 5 spectra recorded for each sample is shown in this table (n = 5). For the present predictions, the standard error of prediction in cross-validation is 5.7% for the α-helix and 6.7% for the ß-sheet, 3.2% for turns and 8% for random coil.

