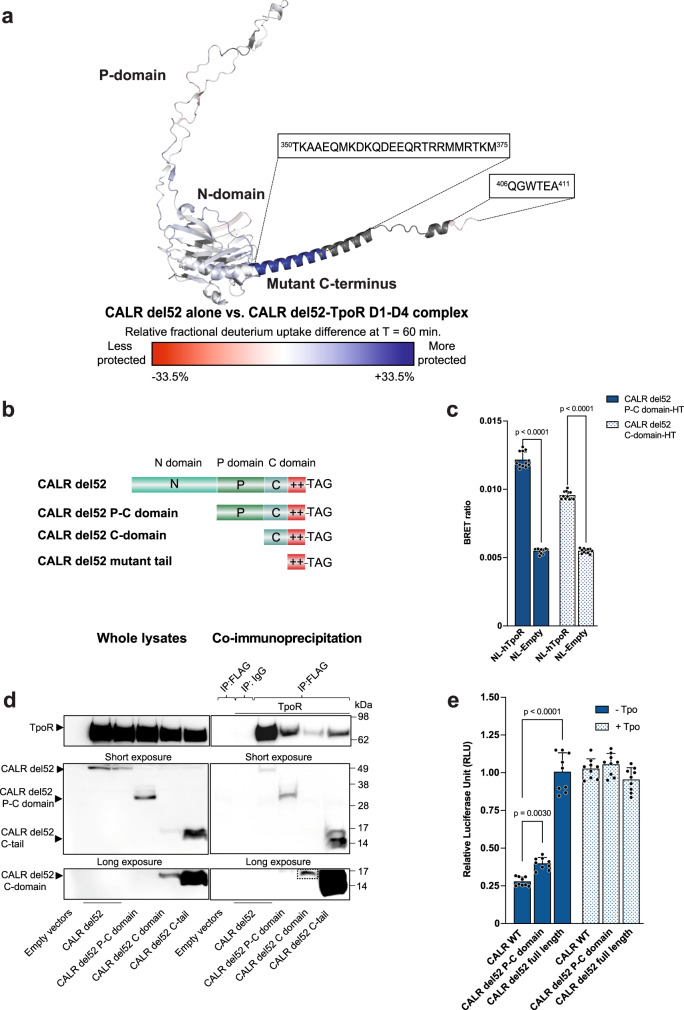
Fig. 2. Interaction between CALR mutant C-terminus and TpoR independently of N-glycans.
a Structure model (AlphaFold 2.018) of CALR del52. Colors represent the difference in relative fractional uptake (ΔRFU) between CALR del52 alone and CALR del52 in complex with TpoR D1-D4 with mature N-glycans. Regions in red and blue are respectively less and more protected in the CALR del52-TpoR D1-D4 complex compared to CALR del52 alone. The scale from red to blue is proportional to the ΔRFU at 1 h incubation in deuterium between indicated species (mean of n = 3 experiments), with dark red and dark blue corresponding to highest differential. Dark gray represents regions without peptide coverage for the given time point. Sequences of the CALR mutant C-terminus are highlighted. Source data are provided as a Source data file. b Representation of N-terminal truncations of CALR del52 fused to either a FLAG tag or a HaloTag at the C-terminus. c NanoBRET between NanoLuc-TpoR (NL-TpoR) or NanoLuc not fused to any protein (NL-Empty) and CALR del52 P-C or C-domain-HaloTag. Data represent mean ± SD (n = 12 biologically independent samples over 4 independent experiments). Data were analyzed by two-ways ANOVA followed by Sidak multiple comparison test. Source data are provided as a Source data file. d Representative co-immunoprecipitation (from 3 independent experiments) of HA-TpoR with CALR del52-FLAG full length or N-terminal truncations as indicated. Source data are provided as a Source data file. e STAT5 transcriptional activity induced by indicated CALR truncations in presence of TpoR. HEK293T were transiently transfected with vectors coding for human TpoR and CALR del52 truncations along with cDNAs coding for STAT5, JAK2 and SpiLuc Firefly luciferase reporter reflecting STAT5 transcriptional activity and normalized with a control reporter (pRLTK) containing Renilla luciferase. Data represent mean ± SD (n = 9 biologically independent samples over 3 independent experiments). Data were analyzed with two-ways ANOVA followed by Sidak multiple comparison test. Source data are provided as a Source data file.

