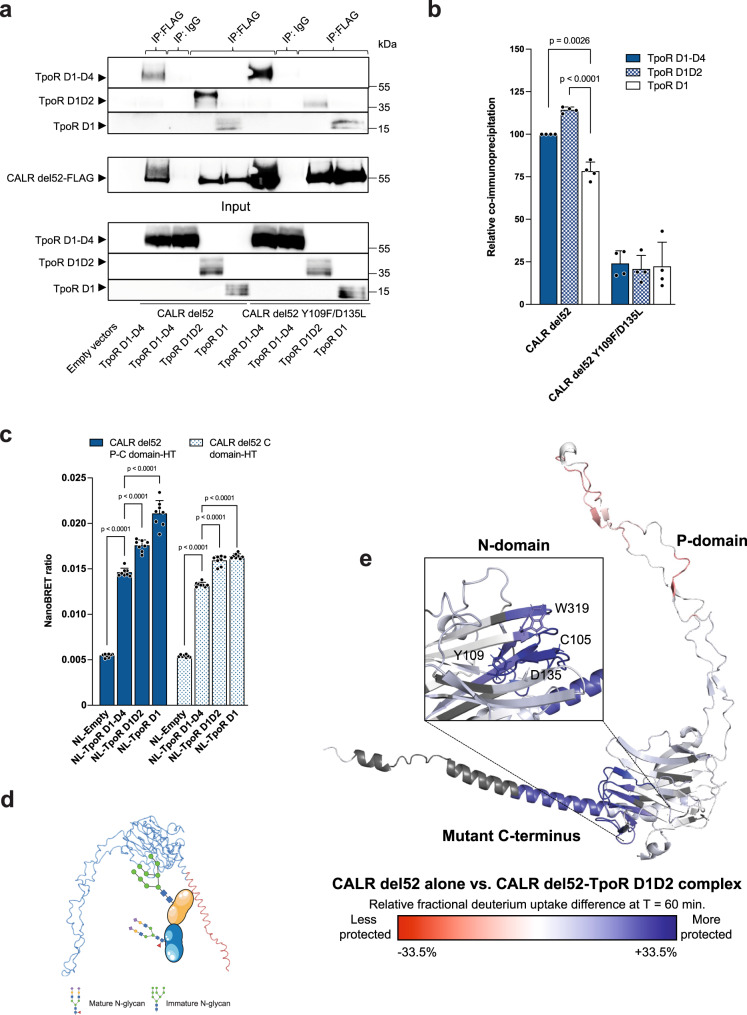
Fig. 3. N-glycan dependent and independent interactions of CALR mutant with TpoR.
a Representative co-immunoprecipitation of HA-TpoR ECD domains by CALR del52-FLAG or CALR del52 Y109F/D135L-FLAG using an anti-FLAG antibody for capture and anti-HA antibody or anti-CALR mutant C-terminus antibody (SAT602) for detection of HA-TpoR and CALR del52-FLAG (and Y109F/D135L mutant), respectively. Source data is provided as a Source data file. b Quantification of relative co-immunoprecipitation of TpoR species by CALR del52 (mutated or not). Western blot quantification performed with ImageJ. Shown are the ratios (+ SD) of TpoR species on CALR del52 normalized for TpoR species expression in whole lysates (n = 4). Data were analyzed by two-ways ANOVA followed by SIDAK multiple comparison test. Source data are provided as a Source data file. c NanoBRET between NanoLuc-TpoR subdomains (or NL-Empty) and CALR del52-HaloTag truncated from the N-terminus. Data represent mean + SD (n = 8 biologically independent samples from 4 independent experiments). Source data are provided as a Source data file. d Cartoon representing the complex between CALR del52 and TpoR D1D2 domain containing immature N-glycans produced in Schneider (S2) cells. Items in this figure were created with BioRender. e Structure model (AlphaFold 2.018) of CALR del52. Colors represent the difference in relative fractional uptake (ΔRFU) at 1 h incubation in deuterium (mean of n = 3 experiments) between CALR del52 alone and CALR del52-TpoR D1D2 complex with immature N-glycans. Regions in red and blue are respectively less and more protected in the CALR del52-TpoR D1D2 complex compared to CALR del52 alone. The scale from red to blue is proportional to the ΔRFU between indicated species with dark red and dark blue corresponding to highest differential. The same scale as Fig. 2a was used for comparison. Raw data are provided in the source file. Dark gray represents regions without peptide coverage for the given time point. The N-glycan binding domain of CALR is highlighted. Source data are provided as a Source data file.

