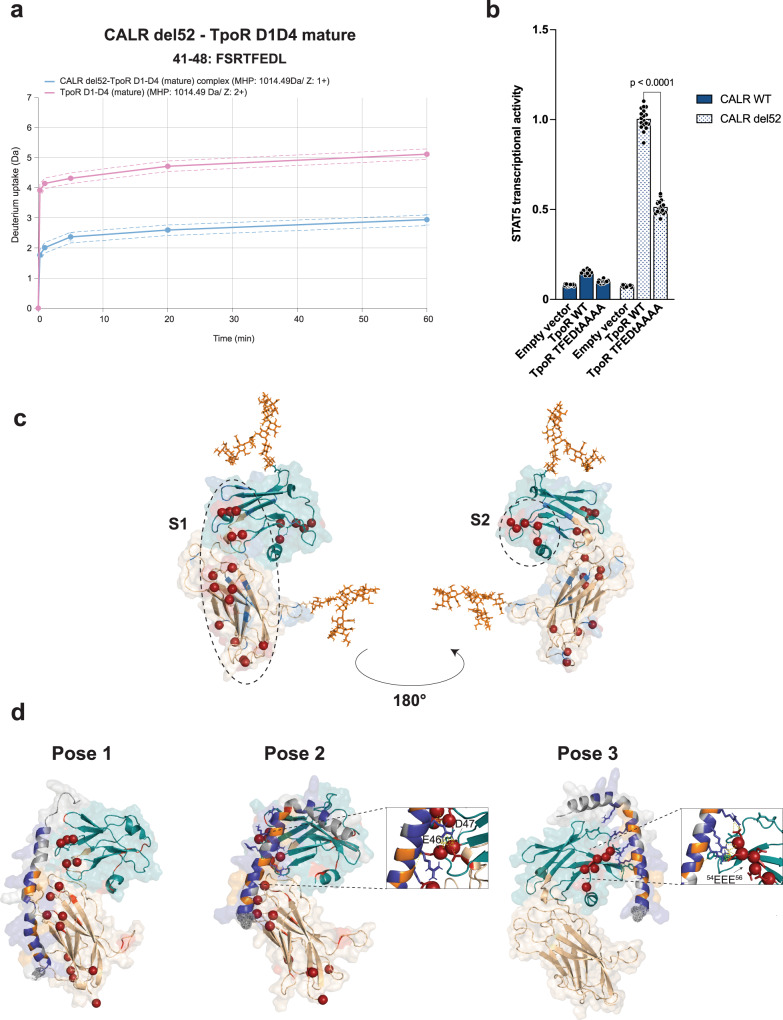
Fig. 4. CALR mutant C-terminus interacts with acidic patches on TpoR D1 domain.
a Deuterium uptake (Da) of the FSRTFEDL peptide from CALR del52 alone or in complex with TpoR D1D4 (with mature N-glycans) at 5 different exchange time points. The dotted lines represent standard deviation (SD), the full line represents the mean of triplicates (n = 3). Source data are provided as a Source data file. b STAT5 transcriptional activity induced by CALR del52 in presence of empty vector, TpoR WT or TFEDtAAAA mutant. Data represent mean ± SD (n = 12 biologically independent samples over 4 independent experiments). Data were analyzed with one-way ANOVA followed by Sidak multiple comparison test. Source data are provided as a Source data file. c Prediction of TpoR D1D2 domain (described in Supplementary Methods). The model shows one extensive (S1) and one more restricted (S2) patch of acidic residues represented by red spheres. Basic residues are shown in blue, acidic residues are shown in red. TpoR D1 domain is shown in blue/green and TpoR D2 is shown in wheat. Complex N-glycans are attached to position Asn117 and Asn178 and are shown in orange. d Pose 1 (left), pose 2 (middle) and pose 3 (right) generated by HADDOCK between CALR del52 mutant C-terminus and TpoR D1D2. The best docking complexes were chosen, as ranked by the HADDOCK score. Highlighted are the strong interactions between Arg of CALR mutant C-terminus and E46 and D47 of TpoR D1 domain for pose 2 and the interactions between Arg of CALR mutant C-terminus and the 54EEE56 motif on TpoR D1 for pose 3. The basic (Arg/Lys) and hydrophobic (Met) residues of CALR del52 mutant C-terminus are shown in dark blue and orange, respectively. Other residues are shown in gray.

