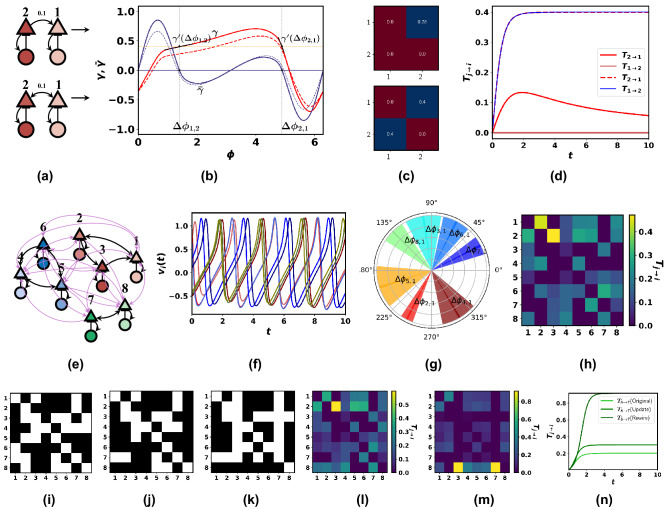
Figure 3.
(a) The Wilson–Cowan neuronal oscillator consisting of two excitatory (triangle) and inhibitory (circle) neurons with average membrane potentials of v and u for two network topologies. The edge weight is 0.1. (b) The coupling function curves for both cases in figure (a). The dark red and blue curves show the coupling function and its antisymmetric curve for the bottom figure in (a). The other two dashed curves correspond to the coupling for the topology in the top Figure (a). (c) The transpose of coupling matrices found by linearizing the coupling functions shown in figure (b) around the zero crossings of in both cases. The (2, 1) element in the upper matrix is 0 as the corresponding network has no connection from 1 to 2 (d) curves for both the topologies in Figure (a). The red curve shows for the upper topology. is 0 for this topology as there is no connection from node 1 to 2. The blue curve and the dotted red curve show and for the topology in bottom figure (a). As the coupling strengths are similar, the two information transfer curves overlap (e) Excitatory and inhibitory network of 8 nodes with couplings 0.015 and 0.1 (f) Oscillatory behaviours of the neurons (g) The phase differences fluctuate around a stable phase-locked state (darker lines) (h) Various information transfers among the excitatory neurons. (i) Given binary interconnection matrix of 8 nodes (j) Interconnection matrix using the update technique of adding 5 new edges with Greedy Algorithm (k) Interconnection matrix using the rewiring technique of 7 nodes using the Greedy Algorithm and ITEC centrality measure, (l) Information transfers among various excitatory neurons after updating with 5 edges (m) Information transfers among various excitatory neurons after rewiring using 7 edges, (n) Evolution of after the update and the rewiring process.

