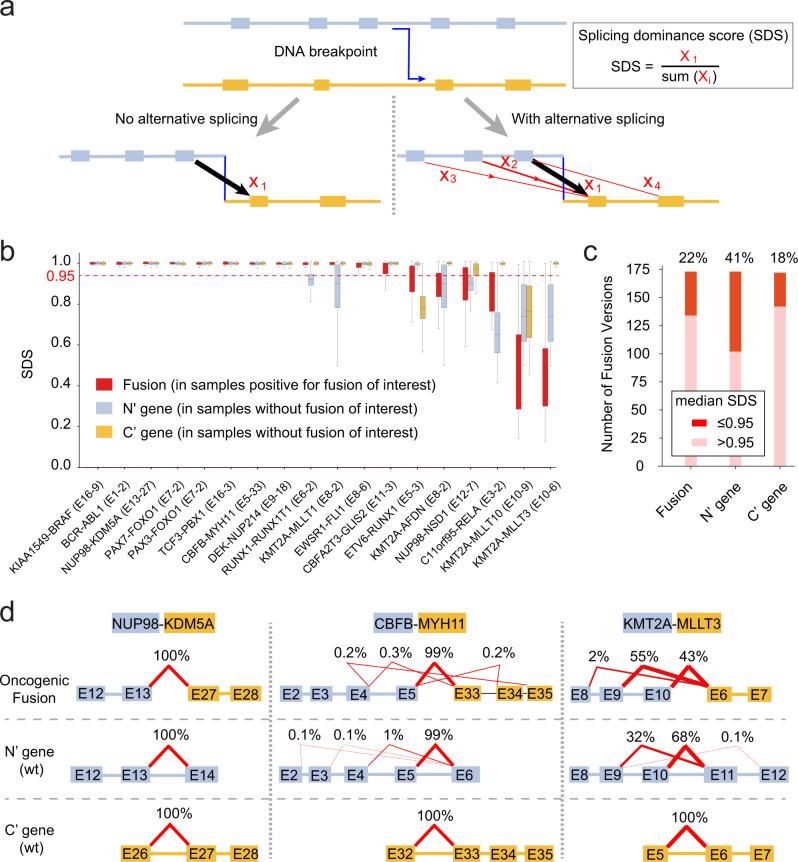
Fig. 4. Alternative splicing in oncogenic fusions.
a Splicing model. The oncogenic fusion defined by a DNA breakpoint (blue line) may or may not be subject to alternative splicing (red lines). We propose a splicing dominance score (SDS) to measure the alternative splicing as a ratio of the count of splicing reads supporting the canonical splicing pattern (X1) to the count of splicing reads spanning both the N’ gene and the C’ gene (X1–X4). A similar score is defined for the wildtype genes (Methods; Supplementary Fig. 6). b SDS score distribution for fusion genes (red) and wildtype N’ (blue) and C’ (orange) genes for 18 intronic versioning with recurrence ≥10, where alternative splicing (SDS <0.95, red dashed line) is observed in 6 (33% of 18) fusions. In boxplot, the lower, center and upper limits indicate 25th, 50th, and 75th percentile, respectively. Whisker is defined using 1.5 IQR. c A similar extent of alternative splicing is observed in 183 intronic versions with recurrence >2. d Example oncogenic fusions and splicing patterns. Splicing patterns for wildtype N’ (blue) and C’ genes (orange) are also presented. Black connections indicate canonical splicing, while red connections indicate alternative splicing. Source data are provided in sheets b–d in Source Data file.

