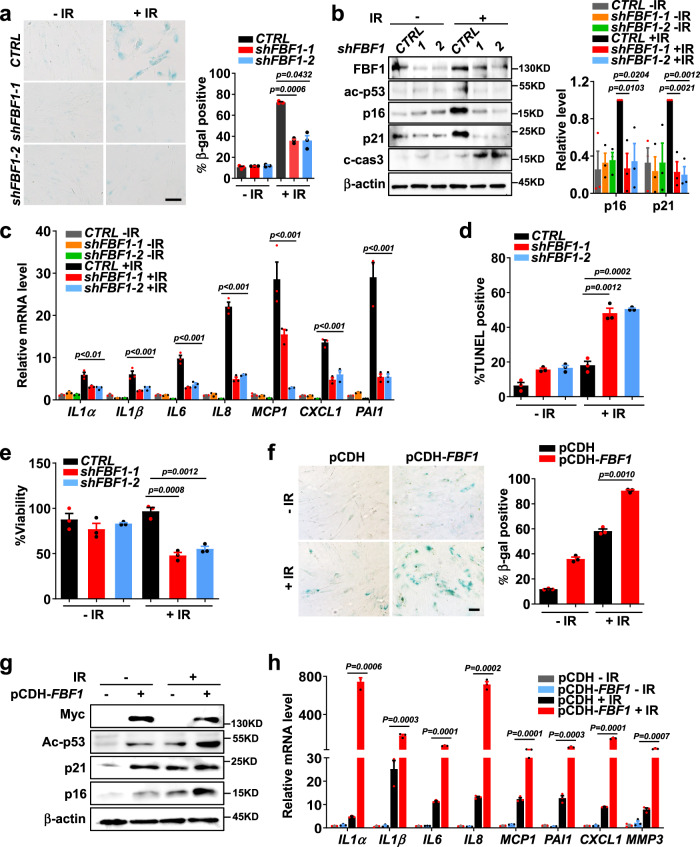
Fig. 2. Transition fiber component FBF1 is a key player in DNA damage-induced senescence.
a–c SA-β-gal staining (n>100 cells per experiment) (a), western blot of senescence markers (b) and relative mRNA levels of SASP genes (c) in IMR-90 cells stably expressing control shRNA or shFBF1 at day 10 post-irradiation. Scale bar, 200 μm. d, e TUNEL assay (n=30 cells per experiment) (d) and viability assay (e) in IMR-90 cells stably expressing control shRNA or shFBF1 at day 3 post-irradiation. f–h, SA-β-gal staining (f), western blot of senescence markers (g) and relative mRNA levels of SASP genes (h) in IMR-90 cells overexpressed with plasmid pCDH vector or pCDH-FBF1-Myc at day 7 after irradiation. Scale bar, 200 μm. All results from n = 3 independent experiments were statistically analyzed and plotted as means ± SEM. Brown-Forsythe and Welch ANOVA tests was used for a and f. Two-way ANOVA followed by Bonferroni multiple-comparison analysis was used for c. Two-tailed Student’s unpaired t-test was used for analysis in b, d, e and h. Source data are provided as a Source Data file.

