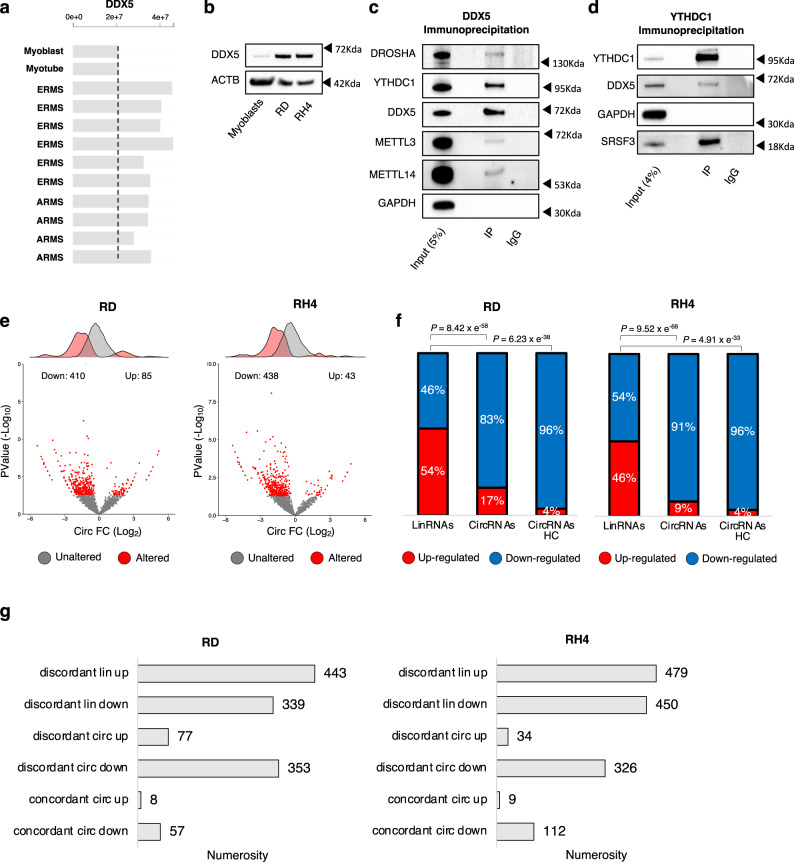
Fig. 4. DDX5 helicase controls circRNA expression and interacts with YTHDC1.
a Protein levels for DDX5 in orthotopic RMS patient-derived xenografts, as compared to normal myoblasts and myotubes. Data derive from https://pecan.stjude.cloud/proteinpaint/study/RHB2018. A vertical dashed line indicates the level of protein expression of DDX5 in normal myoblasts. b Representative western blot to evaluate the levels of DDX5 in wild-type myoblasts, RD, and RH4 cell lines; ACTB was used as loading control. n = 3 biologically independent replicates. c Representative western blot analysis of DDX5 immunoprecipitation from whole-cell lysate in RD cells. The percentage of input is indicated. DROSHA and GAPDH were used as a positive and negative control for the co-immunoprecipitation, respectively. n = 2 biologically independent replicates. d Representative western blot analysis of YTHDC1 immunoprecipitation from whole-cell lysate in RD cells. The percentage of input is indicated. SRSF3 and GAPDH were used as a positive and negative control for the co-immunoprecipitation, respectively. n = 2 biologically independent replicates. e Volcano plots showing for each circRNA identified in the RNA-seq experiment the log2 fold change and the −log10 p value upon DDX5 knock-down in RD (left panel) or in RH4 (right panel) cells. The distributions of the fold change values are shown above the volcano plots. Significantly altered circRNAs (p value < 0.05) or unaltered circRNAs are indicated by red or gray dots, respectively. See the methods section for statistical analyses details. f Stacked bar charts with percentage of down- and upregulated linear (“LinRNAs”), circRNAs (“CircRNAs”), or “high-confidence” circRNAs (“CircRNAs HC”) upon DDX5 knock-down in RD (left panel) or RH4 (right panel) cell lines. P-values for the differences between proportions were calculated using Fisher exact two-tailed test. g Bar-plots depicting the numerosity of different scenarios of deregulation in RD (left panel) or in RH4 (right panel) cells upon DDX5 knock-down. Source data are provided as a Source Data file.

