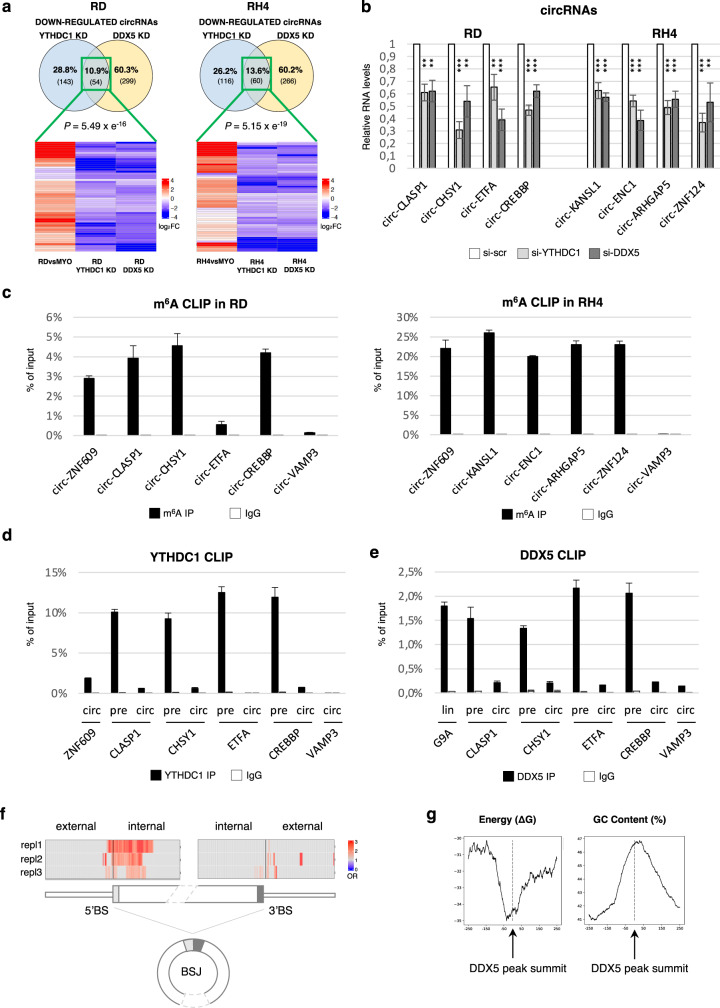
Fig. 5. DDX5 and YTHDC1 directly regulate a subset of circRNAs promoting their upregulation in RMS.
a Venn diagrams (upper panels) showing the overlap between discordant circRNAs downregulated upon YTHDC1 knock-down and those downregulated upon DDX5 knock-down, either in RD (left panel) or in RH4 (right panel). Significance was calculated via Fisher exact two-tailed test. Heatmaps (lower panels) showing log2 fold change of circRNAs at the overlap of the upper Venn diagrams in the comparison between each RMS cell line and wild-type myoblasts as well as in YTHDC1 or DDX5 knock-down in the respective RMS line. b Relative RNA levels of selected circRNAs upon YTHDC1 knock-down (“si-YTHDC1”) or DDX5 knock-down (“si-DDX5”) in RD or RH4. Values are normalized against GAPDH and expressed as relative quantity with respect to scramble siRNA treatment (“si-scr”) set to a value of 1. The relative RNA quantity in the bars is represented as mean of the fold change with standard deviation. n = 3 biologically independent replicates. The ratio of each sample versus its experimental control was tested by two-tailed Student’s t test with correction for multiple test comparison (FDR Benjamini-Hochberg). * indicates a test-derived p value < 0.05, ** indicate a p-value < 0.01, and *** a p value < 0.001. c Levels of selected circRNAs recovered from a representative m6A CLIP in RD (left panel) and RH4 (right panel). CircZNF609 and circVAMP3 were used as positive and negative controls, respectively; immunoprecipitation with IgG was used as control. r, Levels of selected circRNAs recovered from a representative m6A CLIP in RH4 either in control condition (“si-scr”) or upon METTL3 (“si-METTL3”) or DDX5 knock-down (“si-DDX5”); immunoprecipitation with IgG was used as control. The relative RNA quantity in the bars is represented as mean of technical replicates with standard deviation. n = 2 biologically independent replicates. d, e Levels of precursors or mature circRNAs recovered from a representative YTHDC1 (d) or DDX5 (e) CLIP experiment. Values are expressed as percentage of input with standard deviation. CircZNF609 (d) and G9A (e) were used as positive controls. CircVAMP3 was used as negative control. The relative RNA quantity in the bars is represented as mean of technical replicates with standard deviation. n = 3 biologically independent replicates. f Heatmap representing DDX5 binding enrichment in meta-BSJ proximal regions comparing the set of “high-confidence” downregulated circRNAs upon DDX5 depletion in RH4 cells with a set of selected controls from invariant circRNAs. For each DDX5 RIP-seq replicate (“Repl1-2-3”), the odds ratio (“OR”) related to each 100nt window analyzed is depicted. Only bins with significant odds ratio (p value < 0.05) were colored. Statistical significance was assessed using two-sided Fisher exact test. g Line plots representing ∆G (left panel) and GC content (right panel) of 500nt regions centered to DDX5 peak summit of RIP-Seq replicate 1 (see Supplementary Fig. 5 v for replicate 2 and 3). Source data are provided as a Source Data file.

