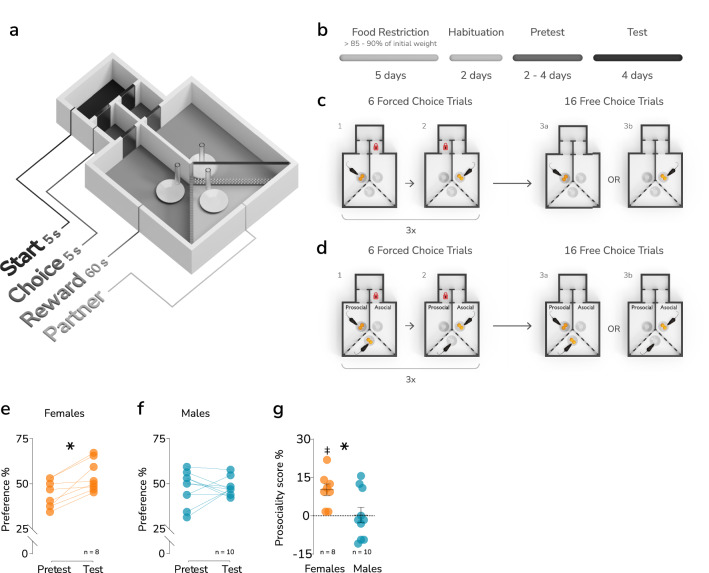
Figure 1.
Prosocial choices in male and female mice. (a) A schematic representation of the testing apparatus. (b) Experimental schedule. (C–D) A diagram summarizing the pretest and test phases of the experiment, respectively. (e–f) The change in preference for the ‘prosocial’ compartment between the pretest and test phases in female and male mice, respectively. The results shown are the mean values from all sessions in the pretest and test phases. A significant difference between the phases is marked with a “*” (paired t-test p < 0.05). Respective group sizes are indicated below the graphs. (g) The difference between females and males prosociality score, calculated as test preference for the prosocial compartment minus pretest preference for the same compartment (%). The bar and whiskers represent the mean and s.e.m. values. A significant difference between means is marked with a “*” (t-test p < 0.05), and a significant difference vs. 0 is indicated by a “‡” (one-sample t test p < 0.05). The group sizes are indicated below the graph.

