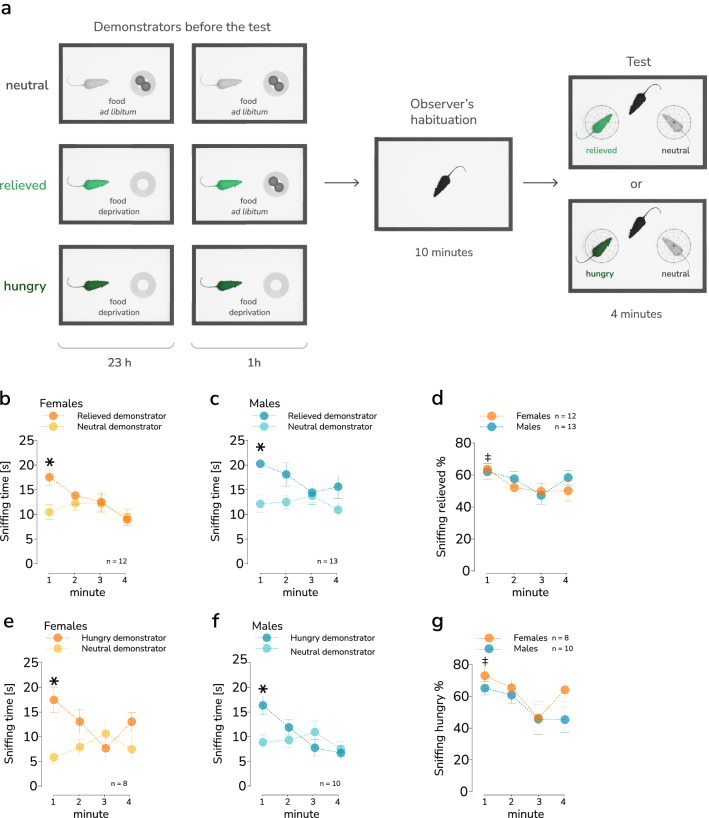
Figure 3.
Affective state discrimination. (a) A schematic representation of the task. (b–c) The time spent by the demonstrator sniffing the relieved (darker points) and neutral (lighter points) demonstrators, female and male mice, respectively. Each point represents the mean time spent sniffing respective partners during a 1 min interval (bin). The whiskers represent s.e.m. values, and significant differences between the mean time spent sniffing in the first 1 min interval are shown with a “*” (ANOVA with repeated measures; post hoc Šídák’s multiple comparisons test, p < 0.05). (d) No difference between female and male mice in preference for sniffing the relieved demonstrator over the neutral demonstrator. The points represent mean values over 1 min intervals, whiskers represent the s.e.m. Significant differences vs. 50% during the first 1 min interval in both female and male mice are indicated by a “‡” (one-sample t-test p < 0.05). (e–f) The time spent by the demonstrator sniffing the hungry (darker points) and neutral (lighter points) female and male demonstrators, respectively. Each point represents the mean time spent sniffing respective partners during a 1 min interval (bin). The whiskers represent s.e.m. values, and significant differences between the mean time spent sniffing in the first 1 min interval are shown with a “*” (ANOVA with repeated measures; post hoc Šídák’s multiple comparisons test, p < 0.05). (g) No difference between female and male mice in preference for sniffing the hungry demonstrator over the neutral demonstrator. The points represent mean values over 1 min intervals, whiskers represent the s.e.m. Significant differences versus 50% during the first 1 min interval in both female and male mice are indicated by a “‡” (one-sample t-test p < 0.05). The group sizes are indicated below the graph.

