Figure 1.
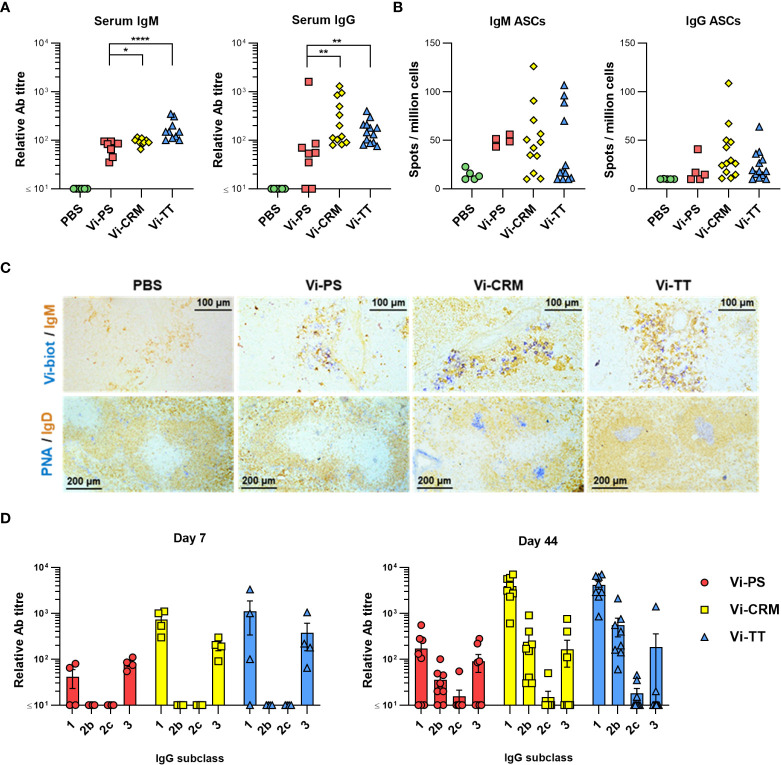
TCV induce rapid IgM and IgG responses and GC. (A) Sera from C57Bl/6 mice 7 days after i.p injection of 2 µg Vi-PS, Vi-CRM197, Vi-TT or PBS were assessed by ELISA for anti-Vi IgM and IgG. Data pooled from 3 experiments with n = 2 or 4 mice/group. (B) Splenic antibody secreting cells (ASCs) producing anti-Vi IgM or IgG were enumerated by ELISPOT, with representative well images below each group. (C) Representative immunohistological images of spleen tissue stained for IgM (brown) and Vi (blue), or IgD (brown) and PNA (blue). 10x magnification. (D) ELISA was used to quantify anti-Vi IgG1, IgG2b and IgG3 in sera from mice 7 days post-immunization, or sera from C57Bl/6 mice immunized i.p with 2 µg Vi-PS, Vi-CRM197, Vi-TT or PBS on day 0 and 35, then challenged with 1x10⁵ CFU Vi+ S. Typhimurium TH177 from day 41-44. Each timepoint is composed of 2-3 experiments with n = 2 or 4 mice/group. Bars represent mean relative antibody titre of each isotype, with SEM. *p≤0.05, **p≤0.01 and ****p≤0.001 by Mann-Whitney U test between individual groups (two-tailed).

