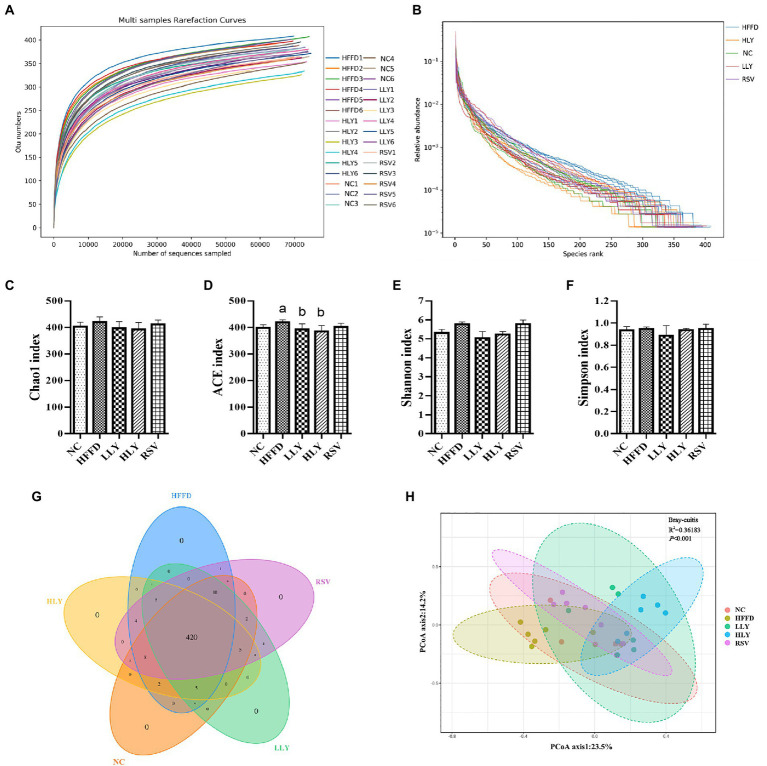
Figure 4.
The overall community structure of fecal microbiota. (A) Rarefaction curves; (B) Rank abundance curves; (C) Chao 1 index; (D) ACE index; (E) Shannon index; (F) Simpson index; (G) Venn of the OTUs; (H) principal coordinates analysis. ap < 0.05, bp < 0.05, cp < 0.05 compared with the NC, HFFD and LLY groups, respectively.

