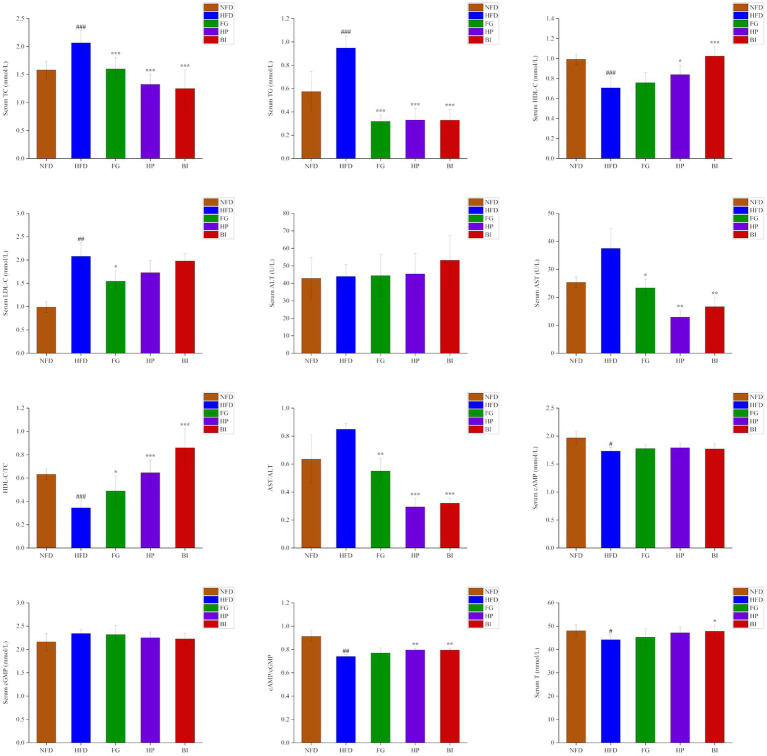
Figure 2.
Effects of FG, HP, and BI treatment on serum biochemical indicators in HFD-fed rats. The Serum TC, Serum TG, Serum HDL-C, Serum LDL-C, Serum ALT, Serum AST, HDL-C/TC, AST/ALT, Serum cAMP, Serum cGMP, cAMP/cGMP, and Serum T levels were shown. Values were expressed as mean ± SD in each group (n = 6). Significantly different from NFD group, #p < 0.05, ##p < 0.01, ###p < 0.001. Significantly different from HFD group, *p < 0.05, **p < 0.01, ***p < 0.001.

