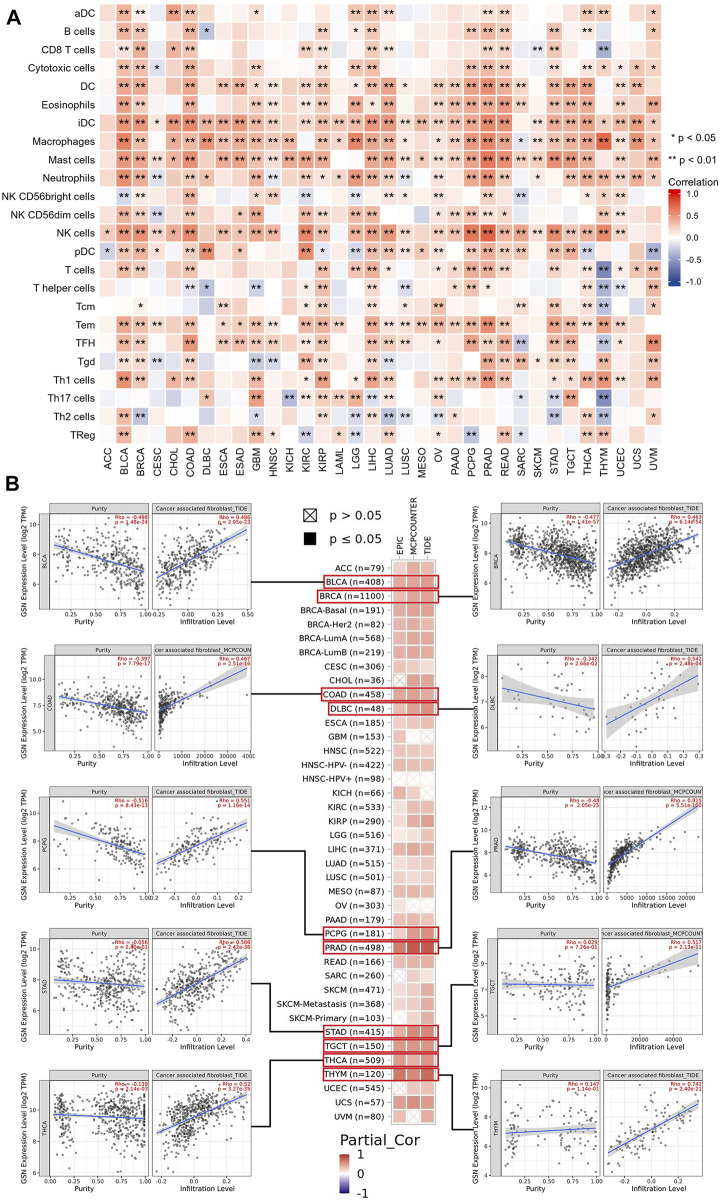
FIGURE 11.
Associations between immune cell infiltration levels and GSN expression in pan-cancer. (A) The correlation of GSN expression and immune infiltration using the ssGSEA algorithm. (B) GSN expression correlation analysis with immune infiltration of CAF cells based on Timer2.0 database, scatter plots including BLCA, BRCA, COAD, DLBC, PCPG, PRAD, STAD, TGCT, THCA, and THYM.

