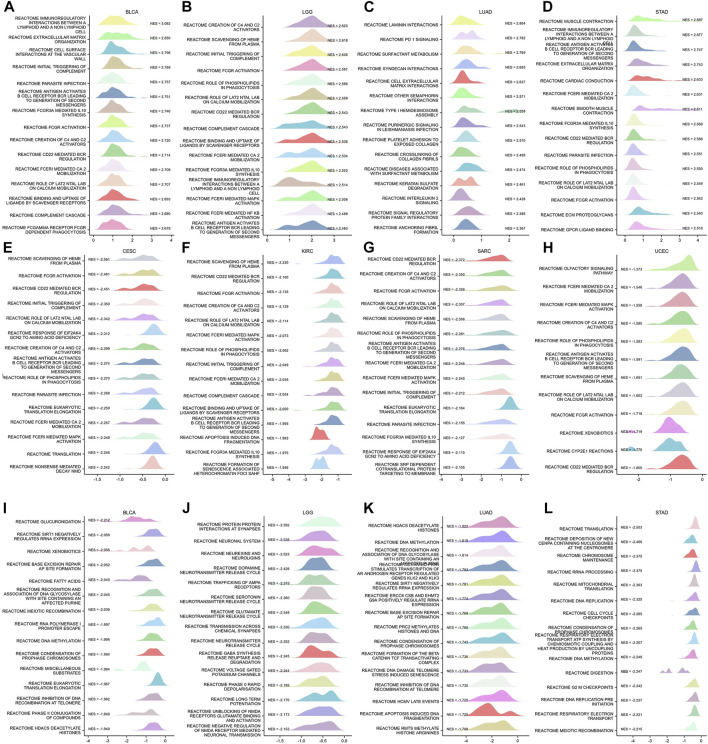
FIGURE 13.
GSEA functional enrichment analysis of GSN in 8 cancers. In BLCA (A), LGG (B), LUAD (C), and STAD (D), the first 15 reaction pathways were positively correlated with GSN expression. In CESC (E), KIRC (F), SARC (G), UCEC (H), BLCA (I), LGG (J), LUAD (K), and STAD (L), the first 15 reaction pathways negatively correlated with GSN expression.

