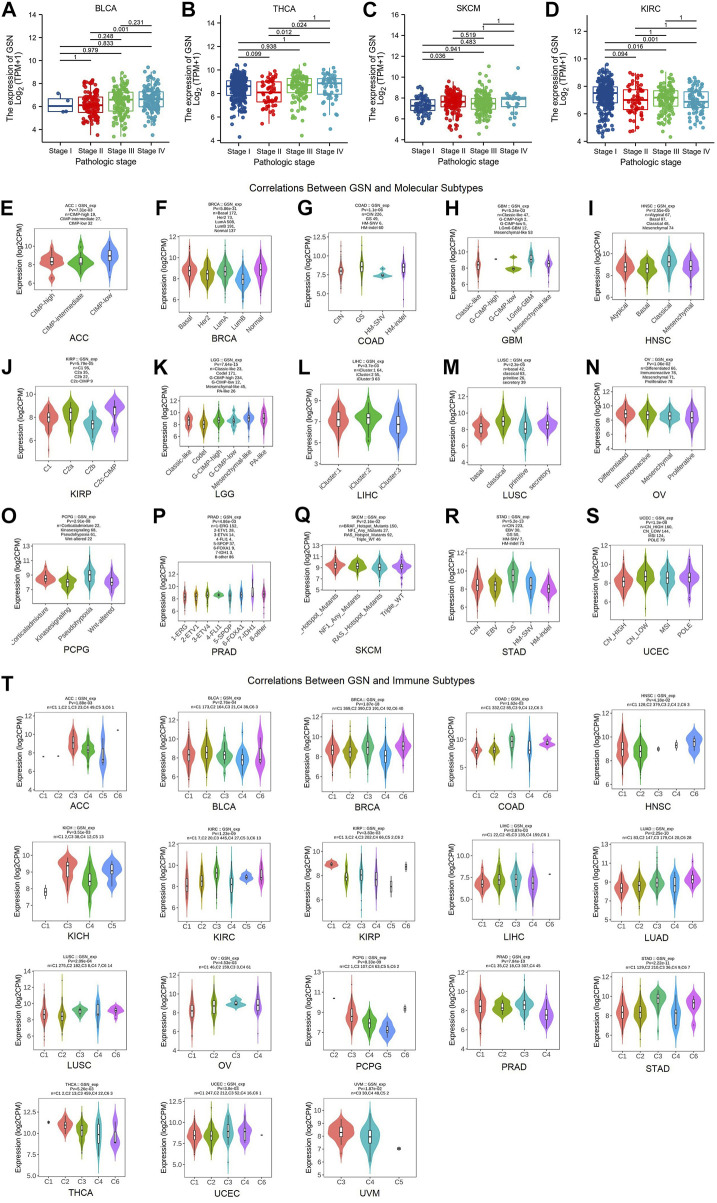
FIGURE 2.
Correlation of GSN expression with different tumor stages, molecular subtypes, and immune subtypes. Correlation between GSN expression and different tumor stages, including BLCA (A), THCA (B), SKCM (C), KIRC (D). Correlations between molecular subtypes and GSN expression across TCGA tumors, including (E) ACC; (F) BRCA; (G) COAD; (H) GBM; (I) HNSC; (J) KIRP; (K) LGG; (L) LIHC; (M) LUSC; (N) OV; (O) PCPG; (P) PRAD; (Q) SKCM; (R) STAD; (S) UCEC. (T) Correlations between immune subtypes and GSN expression across TCGA tumors, including ACC, BLCA, BRCA, COAD, HNSC, KICH, KIRC, KIRP, LIHC, LUAD, LUSC, OV, PCPG, PRAD, STAD, THCA, UCEC and UVM. C1 (wound healing), C2 (IFN-g dominant), C3 (inflammatory), C4 (lymphocyte deplete), C5 (immunologically quiet), and C6 (TGF-b dominant).

