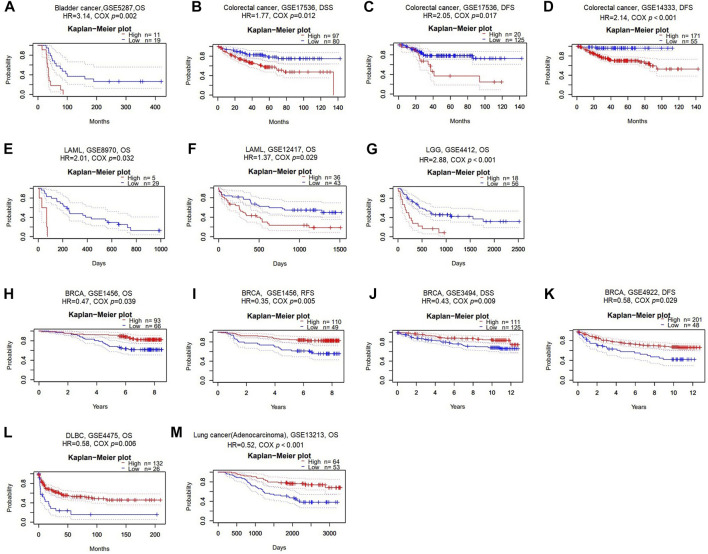
FIGURE 3.
Survival analysis of GSN across different cancer types in the GEO and TCGA datasets. Kaplan-Meier plots of GSN in eleven datasets including GSE5287, bladder cancer, OS (A); GSE17536, colorectal cancer, DSS and DFS (B–C); GSE14333, colorectal cancer, DFS (D); GSE8970, LAML, OS (E); GSE12417, LAML, OS (F); GSE4412, LGG, OS (G); GSE1456, BRCA, OS and RFS (H–I); GSE3494, BRCA, DSS (J); GSE4922, BRCA, DFS (K); GSE4475, DLBC, OS (L); GSE13213, LUAD, OS (M).

