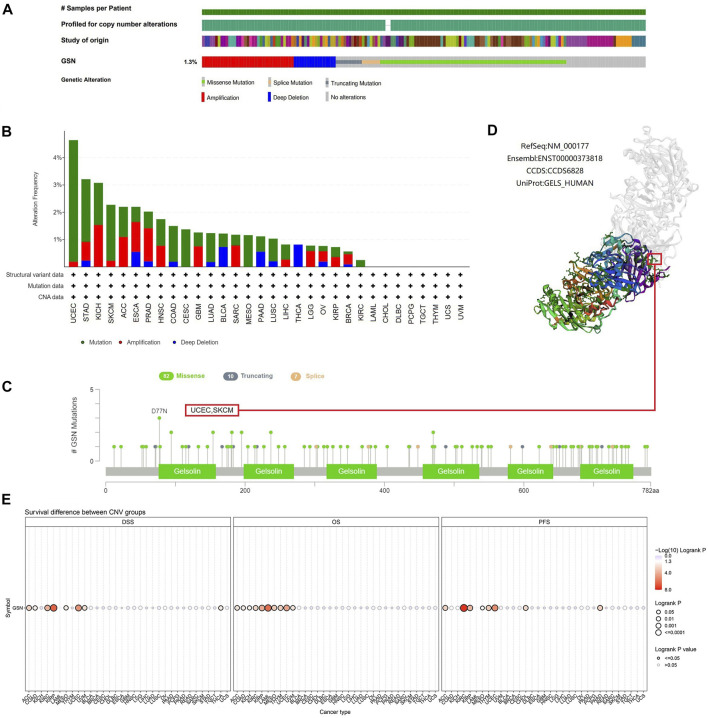
FIGURE 9.
Mutated features of GSN in different tumors. (A) Summary of changes in GSN expression in different tumors. (B) Bar plot of GSN alteration frequency and types across different cancer types. (C) The landscape of GSN mutation with the location, types, and number and their relationship with protein domains. (D) Some GSN mutations are shown on the 3D structure of the protein. (E) Correlation between CNV in GSN and prognosis in cancer patients.

