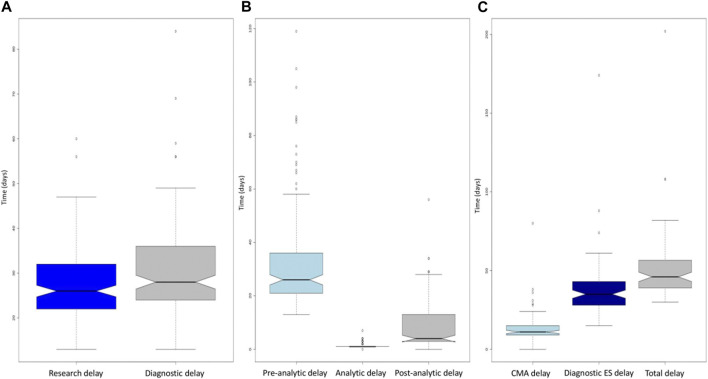
FIGURE 3.
(A) Boxplot of the time required to obtain the report without confirmation (dark blue) and with confirmation (gray) for the entire cohort. The diagnosis delay boxplot is above the research delay one, corresponding to the mandatory diagnostic validation. (B) Boxplot of the pre-analytical (light blue), analytical (dark blue), and post-analytical (gray) turnaround times for the entire cohort. Note the minimal dispersion of the analytical boxplot when compared to the pre- and post-analytical ones. (C) Boxplots of the turnaround times for CMA (light blue), exome (dark blue), and combined CMA and exome (gray). CMA, chromosomal microarray. For the three boxplots, the threshold represents the minimum value, first quartile, mean, third quartile, and maximum. The dots represent outliers.

