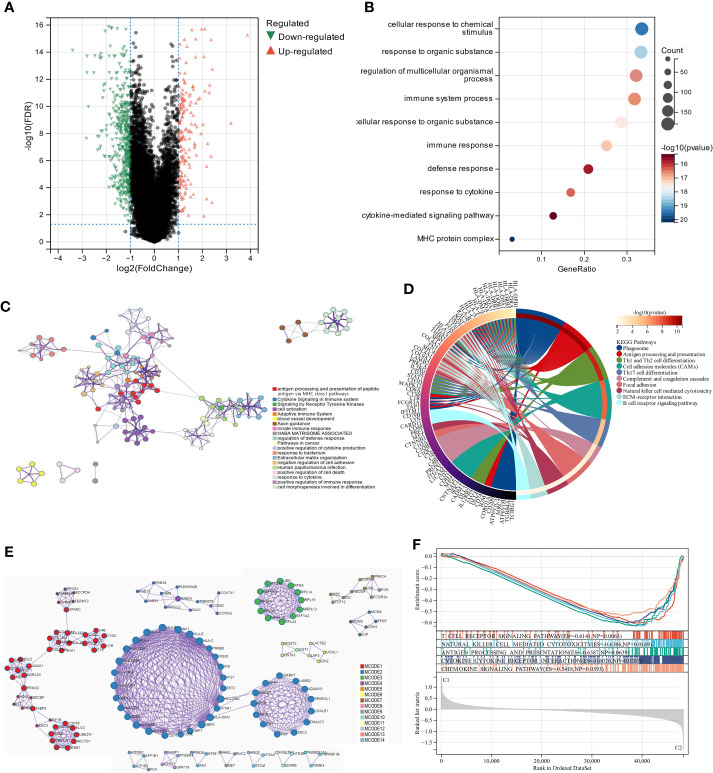
Figure 3.
The analysis of differentially expressed genes and the evaluation of their functions. (A) Volcano plot illustrates the expression of DEGs between the two subgroups. (B, C) Visualization of biological processes that have been enhanced by GO analysis using bubble diagrams and networks. (D) A circle plot displaying the signaling pathways that KEGG analysis has enriched. (E) An analysis of DEGs based on PPI. (F) A GSEA plot depicts the signaling pathway analysis.

