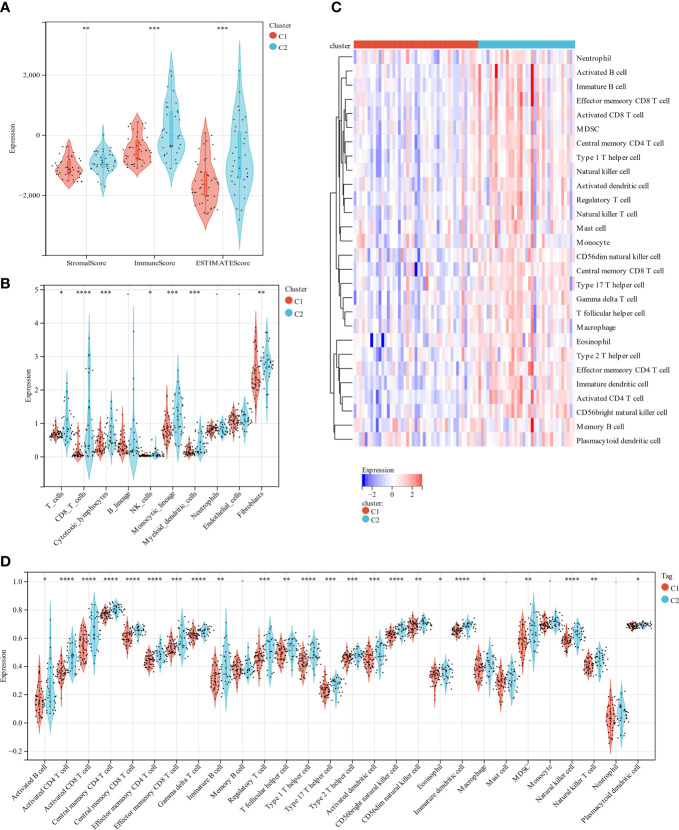
Figure 4.
A comparison of immune infiltration between the two clustered subgroups. (A) The Violin diagram presented the calculation of stromal score, immune score, and estimate score in two subgroups. (B) MCP evaluated the abundance of ten immune filtrating cells. (C) A heatmap displays the level of enrichment for 28 immune-related cells based on a ssGSEA algorithm. (D) Statistical analysis of ssGSEA. *p < 0.05; **p < 0.01; ***p < 0.001 ****p < 0.0001.

