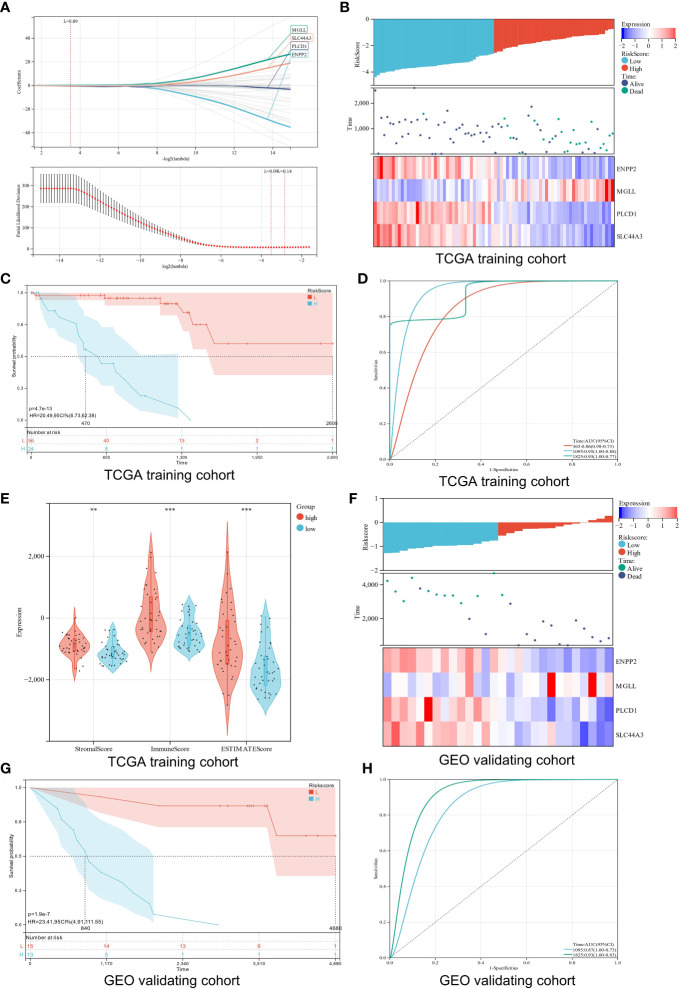
Figure 5.
Construction and verification of a risk model. (A) Analysis using LASSO with a minimal lambda. (B) A heatmap displays the survival status and risk score of UM patients based on the expression of four potential genes in two groups. (C) Survival curves of UM patients in two different groups. (D) A risk model with ROC curves that are time-dependent. (E) Stomal score, immune score, and ESTIMATE score are calculated using the ESTIMATE algorithm. (F) Four candidate genes were expressed in the verification cohort with survival status and risk score indicated. (G) An analysis of the survival curves for high-risk and low-risk patients in the verification cohort. (H) The ROC curve for the risk model’s verification cohort. **p < 0.01; ***p < 0.001

