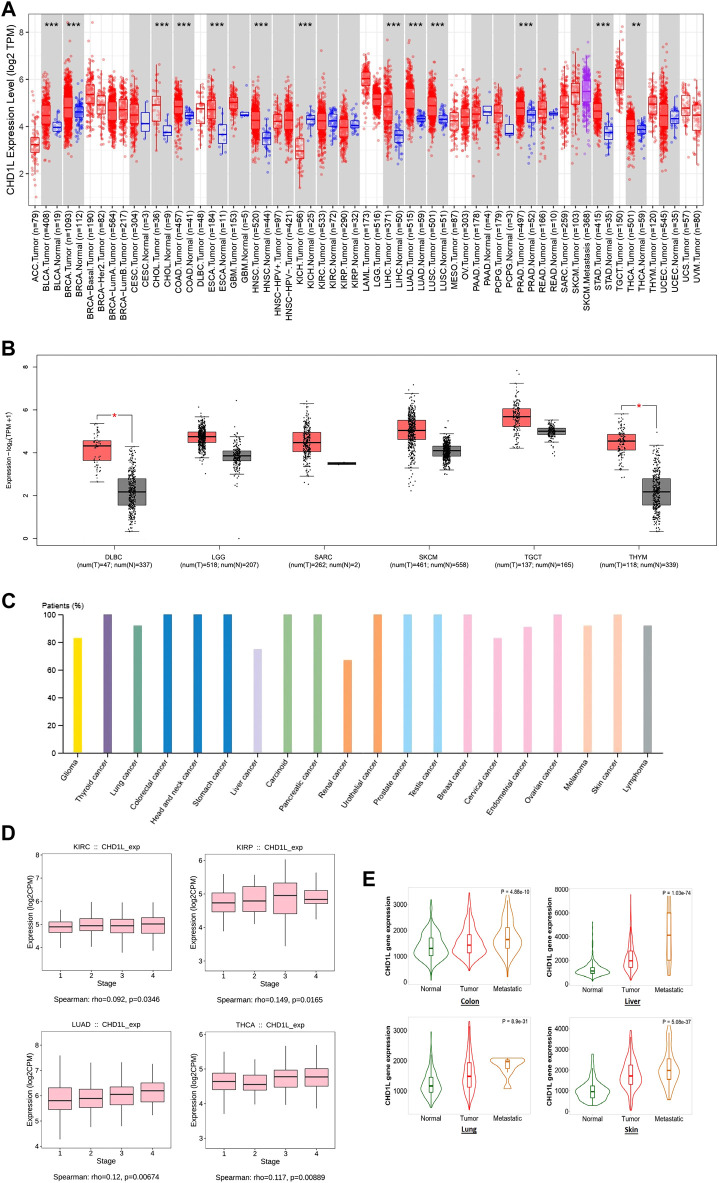
FIGURE 1.
CHD1L expression assessment in human cancers. (A) Differential expression of CHD1L in a panel of TCGA tumors analyzed by TIMER2.0. (B) The tumors that lack normal tissue for comparison in TIMER2.0. database and experienced a trend of elevated CHD1L expression in tumor versus normal tissue when analyzed in the GEPIA database. (C) High level of CHD1L expression in several human cancers analyzed on HPA. (D) Tumors experienced a positive correlation between CHD1L expression and the tumor stage when analyzed with the TISDIB webserver. (E) Tumors experienced a consistent positive correlation between CHD1L expression and tissue type (normal-tumor-metastatic).(a),(b)

