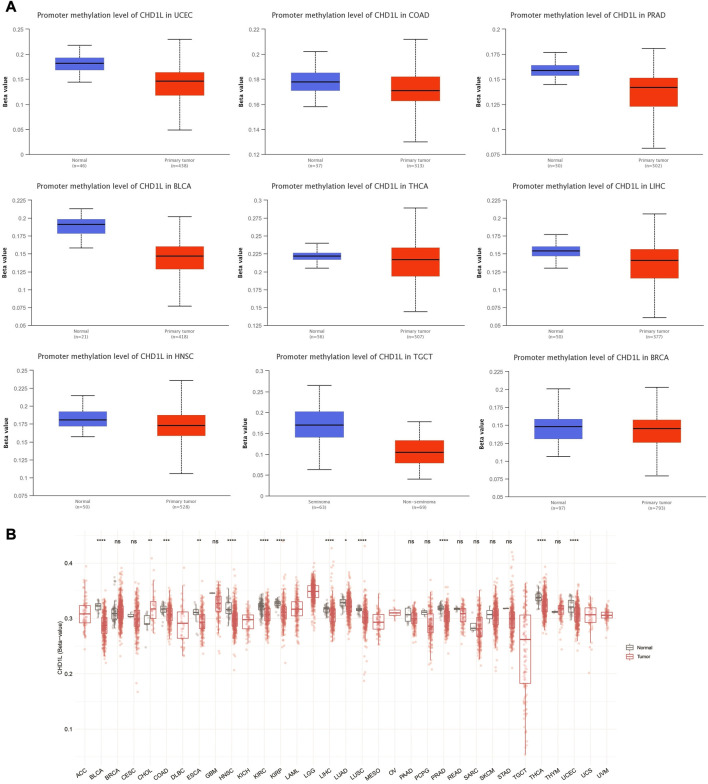
FIGURE 6.
Differential methylation analysis of CHD1L in tumor samples versus normal ones. (A) Tumors experienced higher methylation in the CHD1L promoter region in normal samples versus tumors as assessed by UALCAN analysis. (B) Analysis of CpG-aggregated methylation of CHD1L in a list of human tumors.

