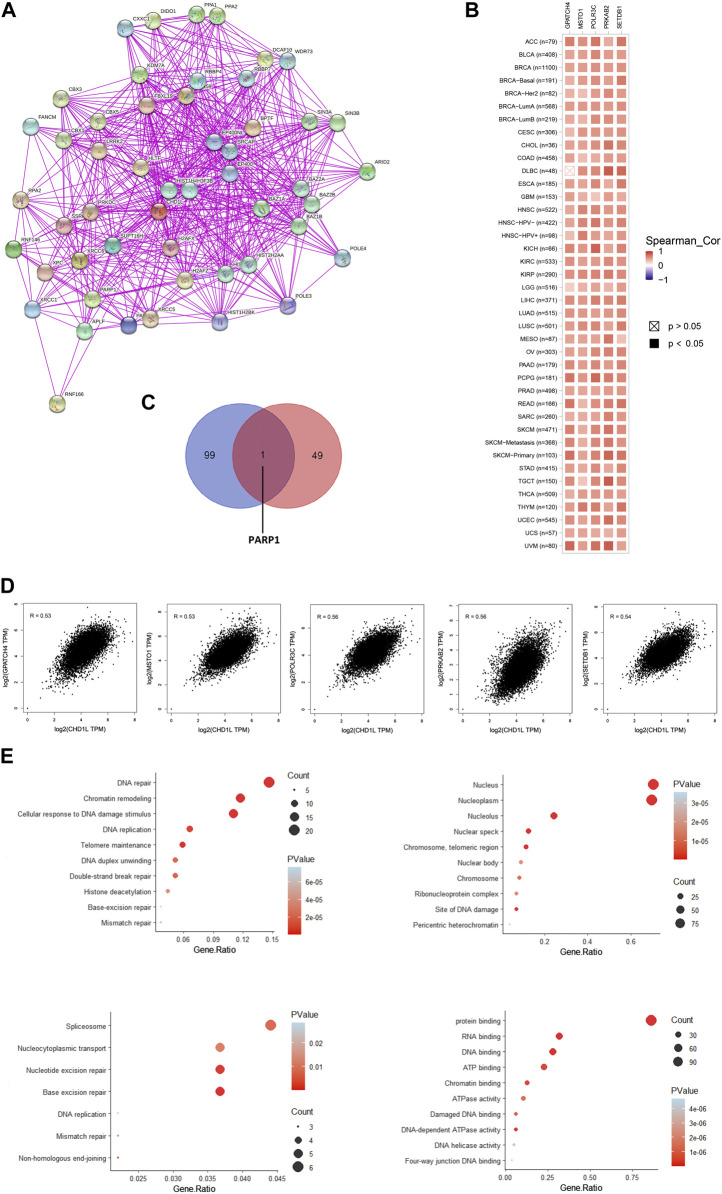
FIGURE 9.
CHD1L-protein network interactions. (A) A map of the top 50 CHD1L interacting proteins as determined by the STRING database. (B) Heatmap for top five CHD1L-correlated proteins in the tumor tissue. (C) Venn diagram showing the intersection between CHD1L interacting and correlating proteins. (D) Expression correlation between CHD1L and genes (GPATCH4, MSTO1, POLR3C, PRKAB2, and SETDB1) as determined by GEPIA2. (E) KEGG/GO enrichment analysis based on CHD1L-binding and interacted genes.(a), (b)

