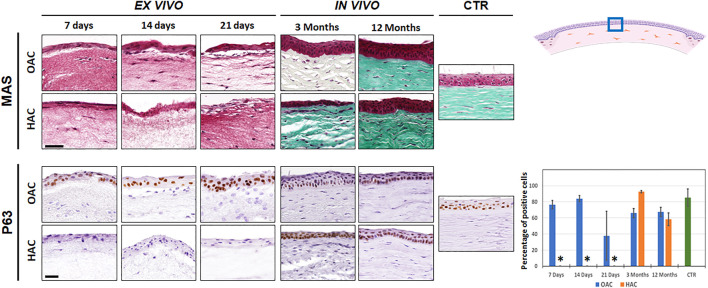
FIGURE 2.
Histological evaluation of orthotypical (OAC) and heterotypical (HAC) artificial corneas and controls. The top panel corresponds to the analysis using Masson’s trichrome staining (MAS), whereas the lower panel shows the immunohistochemical analysis of p63. In both cases, the area in which the in vivo histological images were obtained is labeled with a blue square in the illustration representing the rabbit cornea shown at the upper right corner. Bioartificial corneas kept ex vivo for 7, 14 and 21 days, and corneas grafted in vivo for 3 and 12 months are shown. Controls (CTR) correspond to native, normal human corneas. Scale bars: 50 µm (applicable to all images). The histogram corresponding to the p63 panel shows the results of the quantitative analysis of the percentage of positive cells in each group. Asterisks represent statistically significant differences as compared to CTR corneas.

