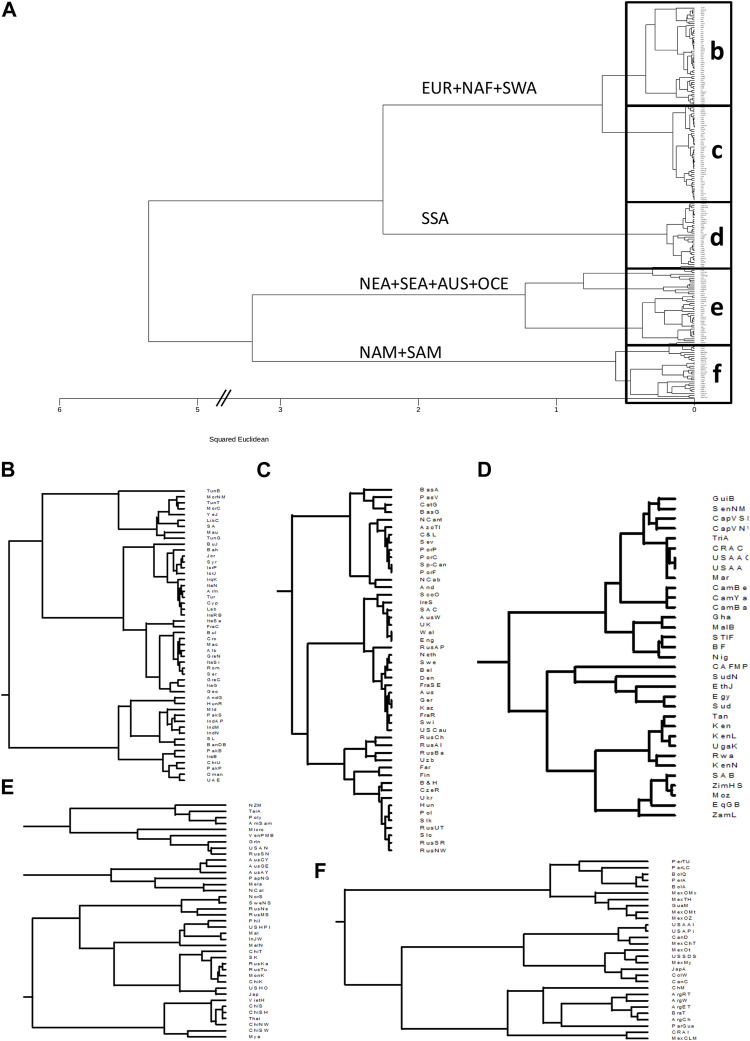
FIGURE 1.
Clustering based on HLA class I frequencies identifies continental and intracontinental population similarities. (A): Dendrogram generated with minimum variance clustering analysis of squared Euclidean distances calculated using 50 HLA-A and HLA-B allele group frequencies in 200 worldwide populations. Main branches are labelled according to the predominant continental origin of populations forming its clusters. b-f. Panels show the detail of the boxes in a. (B): NAF, North Africa; SWA, Southwest Asia. (C): EUR, Europe. (D): SSA, Sub-Saharan Africa. (E): NEA, Northeast Asia; SEA, Southeast Asia; AUS, Australia; OCE, Oceania. (F): NAM, North America; SAM, South America.

