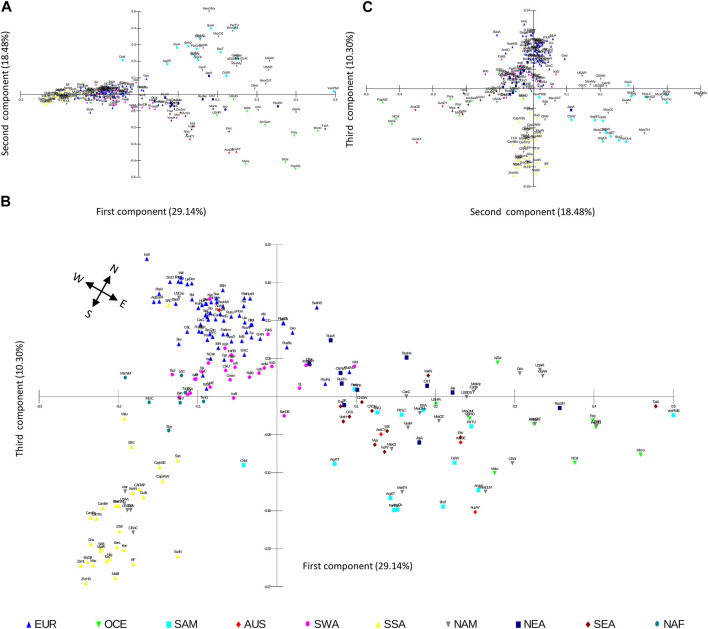
FIGURE 6.
PCoA scatterplots based on HLA class I frequencies correlate with population geographic location. (A–C). Population scatterplots for the PCoA case scores based on Euclidean distances calculated on 50 HLA-A and HLA-B allele group frequencies in 200 worldwide populations are plotted for the first (29.14% of variation), second (18.48%), and third (10.30%), components. A cardinal rose is included to guide pseudo-cardinal directions in b. Population samples are depicted according to their geographic continental classification. AUS, Australia; EUR, Europe; NAF, North Africa; NAM, North America; NEA, Northeast Asia; OCE, Oceania; SAM, South America; SEA, Southeast Asia; SWA, Southwest Asia; SSA, Sub-Saharan Africa.

